173 тысяч подписчиков
91 видео
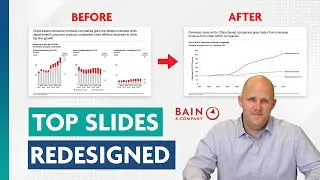
I took top-tier consulting slides and made them better
Effective design hidden in plain sight
I hated team-building exercises, until I watched this TED talk
Top 8 PowerPoint Hacks for Consultants
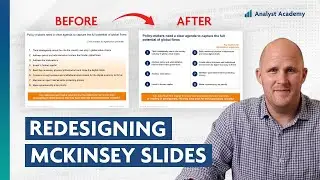
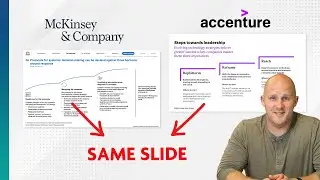
How I redesigned 3 McKinsey slides (and made them better!)
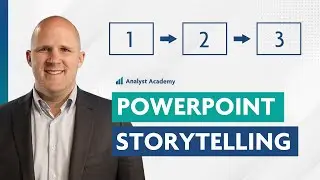
PowerPoint Storytelling: How McKinsey, Bain and BCG create compelling presentations
Understand any PowerPoint slide in 5 seconds
Consultant Explains the Pyramid Principle
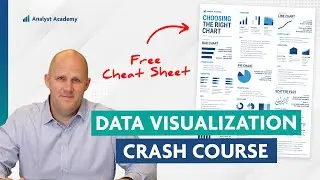
Data Visualization Crash Course | Consulting Best Practices
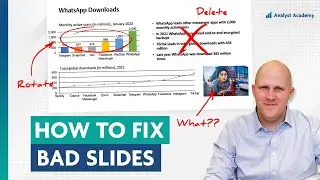
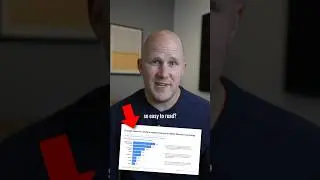
How to Fix a Bad PowerPoint Slide
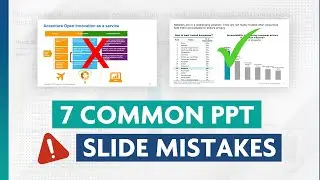
7 PowerPoint mistakes that are killing your presentation
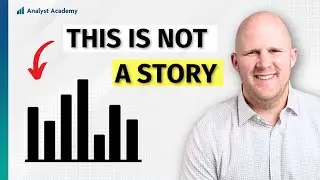
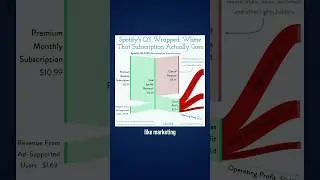
Stop Sharing Data—Start Telling Stories
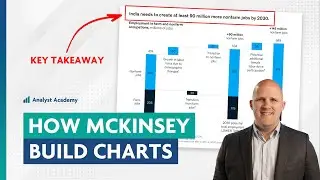
This is how McKinsey tells stories in PowerPoint
The 5 Most Popular Consulting Slides (and how to build them)
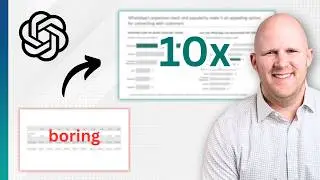
How I Use ChatGPT to 10x My PowerPoint Slides
The real reason McKinsey consultants use the Pyramid Principle
CAGR Explained | What it actually means and why it’s so useful
Actually, pie charts are fine 👍
The mistake every new consultant makes
I turned this fancy chart into a realistic PowerPoint slide
The 3 most common slides at McKinsey, BCG, and Bain
Who makes the best charts on the internet?
The key to a great PowerPoint slide
The Secret Formula Behind Iconic Presentations (Steve Jobs & More!)
How to Persuade Any Audience
How to Give a Presentation Like Steve Jobs (and other iconic presenters)
Data Visualization Design
How to create a "consulting" presentation in 2024
Takeaway Box: What it is and when to use it
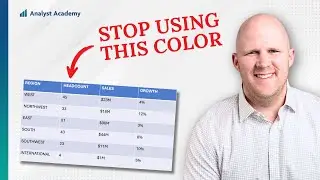
Ugly PowerPoint Slides? It's Probably Your Colors
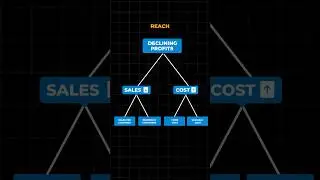
The hidden value of issue trees in consulting
Here’s how I improved this McKinsey slide
Where to get beautiful PowerPoint templates for free
Tesla makes cars, but can they make PowerPoint slides??
🎥🍿 PowerPoint Storytelling
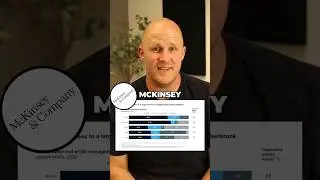
How McKinsey creates million dollar charts and presentations
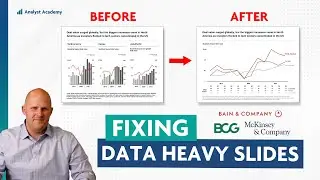
How I fixed these data-heavy slides from McKinsey, BCG, and Bain
Stop using these A.I. tools to make presentations. Do this instead.
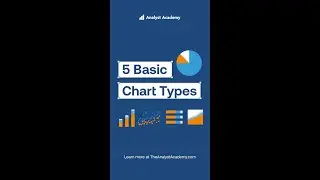
5 Basic Chart Types
How I use PowerPoint for MAC (My Best Hacks!)
How to fix a bad PowerPoint slide
This Harry Potter chart is not like other charts
When to use a waterfall chart (and how to make one)
This chart is weird but effective
Why this slide from Google is so easy to read
How to Build PowerPoint Slides Like a Graphic Designer
10x your ChatGPT answers with this simple strategy
ChatGPT just got a MAJOR update
How Margaret Thatcher Persuaded Audiences
Build your own “McKinsey Style” Presentation (Full Tutorial)