Actually, pie charts are fine 👍
A lot of people are against using pie charts including some data visualization experts.
But here’s the thing… they’re all wrong.. well, sort of.. let me explain…
The basic case against pie charts is that they aren’t good for comparing categories against each other.
If I have data for different vehicle types on the road for example, a pie chart doesn’t do a good job of telling me there are more trucks than SUVs, because these two slices look about the same.
In other words, it’s hard to compare the size of the slices against each other because you’re kind of comparing the area of each slice.
Whereas in a bar chart, the size difference is clear because you’re comparing the length of each bar, not the area.
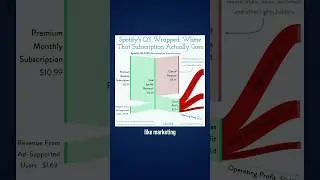
But let’s say I wanted to show the portion cars and trucks together make up of the total. In a bar chart, it’s kind of hard to tell that these two categories together account for about 2/3rds of all vehicles. Put this in a pie chart though, and it’s a lot more clear.
That’s because our brains naturally associate circles with 100%, so it’s easy to understand visually the portion one section makes up of the total.
For most situations a bar chart is a really good choice. But, when you’re trying to show the portion one or multiple categories make up of the total, there’s nothing better than a classic pie chart.
=============================================
📣 FREE STUFF
1-Month Ampler Subscription* ☞ https://bit.ly/3tFq4Ze
SlideStart (Slide Database) ☞ https://bit.ly/3HctLIM
Slide Building Course ☞ https://bit.ly/3v5vcCZ
Umbrex Template ☞ https://bit.ly/3S7dxar
🏆 COURSES
Presentation Design Course ☞ https://bit.ly/3UJJi88
Data Visualization Course ☞ https://bit.ly/3TKt11s
PowerPoint Speed Course ☞ https://bit.ly/3hOxjaM
Courses for Teams ☞ https://bit.ly/3H4YSGv
🎬 VIDEOS
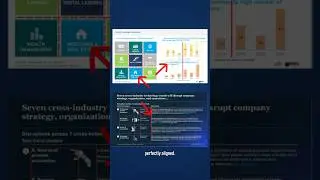
• The 5 Most Popular Consulting Slides ...
• Why McKinsey uses blue, and other col...
• How I redesigned 3 McKinsey slides (a...
• How McKinsey creates million dollar c...
🚀 MORE STUFF
Follow us on Instagram ☞ https://bit.ly/3H7S3ny
Connect on LinkedIn ☞ https://bit.ly/41T7SIk
Paul's LinkedIn ☞ https://bit.ly/3tyAOsr
*Affiliate relationship
=============================================
ABOUT US
At Analyst Academy, we teach high-value consulting skills found at the world's top consulting firms. Our clients include small businesses, Fortune 500 companies, universities, and individual students in 100+ countries around the world. Each of our courses combine years of knowledge from high-performing consultants into highly engaging lessons packed full of best practices, time-saving tricks, and some of the industry's best kept secrets. Our downloads, courses, and articles are all inspired by best practices from the consulting industry. Learn more at https://www.theanalystacademy.com
All views expressed on this channel are that of Analyst Academy LLC and its employees. Any materials mentioned or shown have been obtained through publicly available sources (e.g. firm or client website).
#powerpoint #presentations #consulting #datavisualization