Introduction to the mode
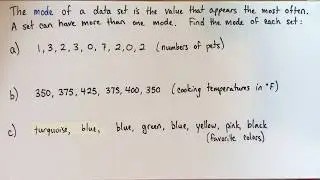
The mode is the value in a set of data that occurs the most often. I'll show you three examples of how to find the mode.
In the first example, we have the following number of pets: 1, 3, 2, 3, 0, 7, 2, 0, 2. Since there are three 2s, and no more than two of any other number, the mode is 2.
The second example lists the following oven temperatures (in degrees F): 350, 375, 425, 375, 400, 350. The temperatures 350 and 375 each occur twice, while the other temperatures only occur once. So this data set has two modes: 350 and 375.
The last example is a list of favorite colors: turquoise, blue, blue, green, blue, yellow, pink, and black. While we can only calculate the mean and median if our data is numerical, it is indeed possible to calculate the mode categorical data like this list of colors. Because it occurs the most often, the mode of this list is "blue".
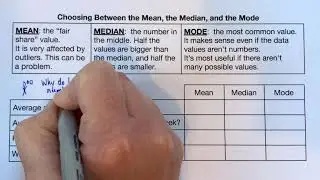
This video is part of a playlist on the mean, the median and the mode. Learn what they are, how to calculate them, when each is useful, and the limitations of each. See more here: • Mean, median and mode