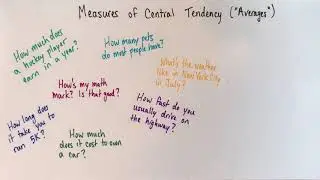
Calculate the mode from a frequency table (tally chart)
Even though the mode is usually easy to find, there's a common error students make when calculating it from a frequency table, or tally chart. I'll explain what it is and how to avoid it.
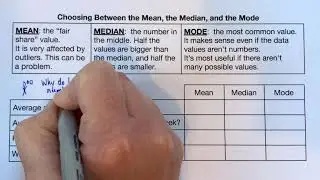
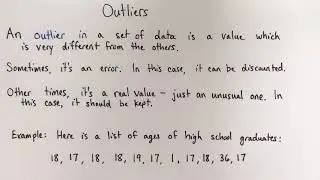
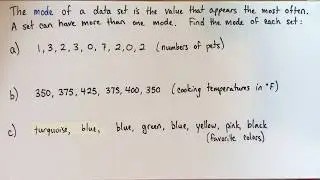
The mode is the value in a set of data that occurs the most often. While finding the mode is usually fairly straightforward, there is a common mistake many people make when calculating the mode from a frequency table (which is also called a tally chart).
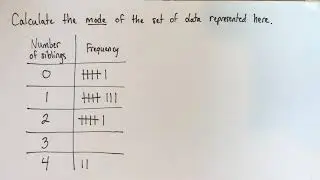
I'll consider an example of a frequency table which shows the following information:
6 people have no siblings
8 people have one sibling
6 people have two siblings
0 people have three siblings
2 people have four siblings
The common error is to say the the mode of this data is 6, because there are 6 people in each of two categories. But that's wrong, because it confuses the data themselves with the frequencies of the data.
I'll remind you that the mode is the value that occurs the most frequently, and that our table represents the list: 0, 0, 0, 0, 0, 0, 1, 1, 1, 1, 1, 1, 1, 1, 2, 2, 2, 2, 2, 2, 4, 4. Once we write out that list, it's clear that the modal number of siblings is 1, because it was the most common value in the set of data.
This video is part of a playlist on the mean, the median and the mode. Learn what they are, how to calculate them, when each is useful, and the limitations of each. See more here: • Mean, median and mode