14-Creating a Map
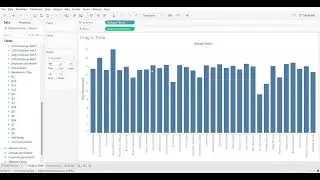
In this video, we will go over how to create a map visualization in Tableau. Below are timestamps of the information we will be covering in the video:
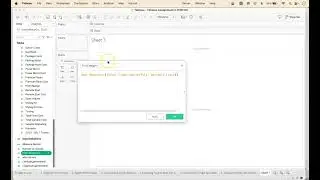
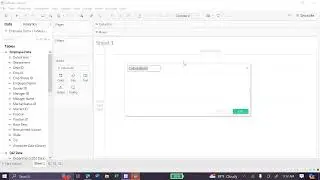
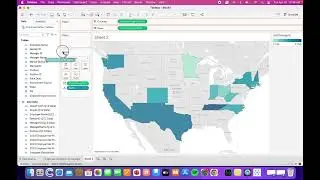
0:00 - 0:24 - Creating a map visualization
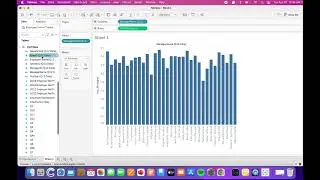
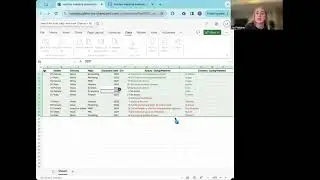
0:25 - 0:45 - Adding data to visualization
0:46 - 0:59 - Using filters
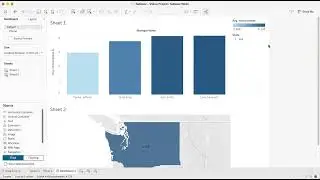
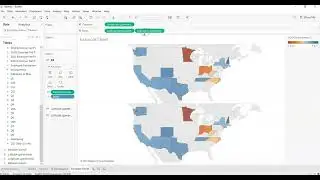
1:00 - 2:04 - Map Layering using Dual Axis tool
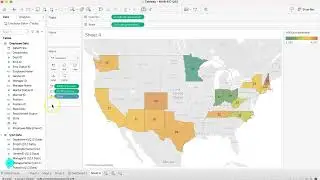
2:05 - 2:25 - Map labeling and clean visualization
By the end of the video, you should be able to create your own map visualization in Tableau. For more information on how to get started with Tableau and how to create other visualizations refer our YouTube channel and videos in this series.
The Vandal Analytics YouTube Channel includes bite-sized, student-created, how-to videos for that moment when you are using Tableau, Python, or Excel, or preparing to perform interviews or a journey mapping exercise and need a simple reminder about how to perform a task. Learn more about Vandal Analytics and the University of Idaho’s College of Business and Economics.
#tableaututorial #mapvisualization #tableau #MIS #analytics #mac #