16-Creating Bar Chart1
In this video, you will learn or have a refresher on how to create a Bar Chart using Tableau 2024.
Creating a Bar Chart using Tableau can be done 3 different ways and this video will go into
detail about how to create those as well as changing the field to average along the way.
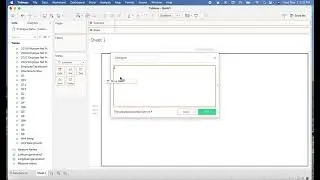
We will experience an unexpected hiccup in the video when we Switch the Calculated Field of
Inclusiveness in the Rows from SUM to AVERAGE, the drop down doesn’t appear in the videos.
To make up for this incident I have written out the visualization to help guide you.
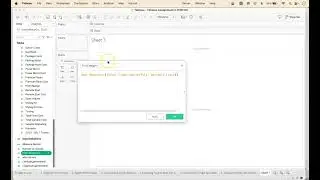
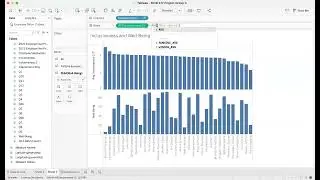
Click on the drop down arrow next to SUM(Inclusiveness) on the Rows spot. Then click
on the Measure option then move the mouse to the right a little and then select our second option
which is Average. That is how you get the AVERAGE from your parameter instead of the SUM
Time Stamps
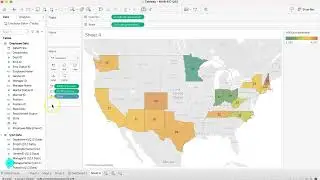
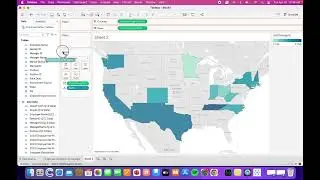
0:00-0:36 Explanation of Data & options
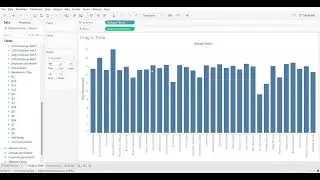
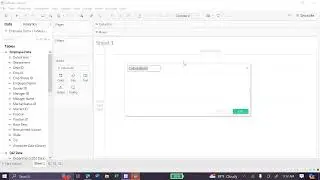
0:37-0:58 Explanation of Drag to Pane for Bar Chart
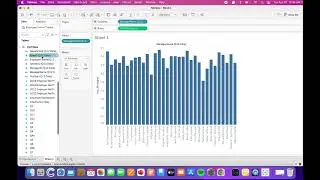
0:58-1:14 Switch Inclusiveness from SUM to Average
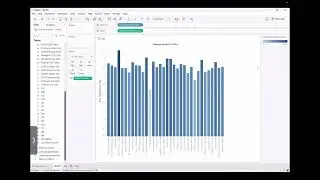
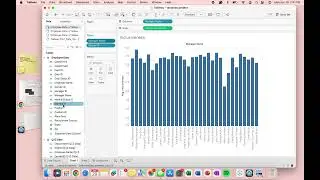
1:19-1:41 Explanation of Double-Click for Bar Chart
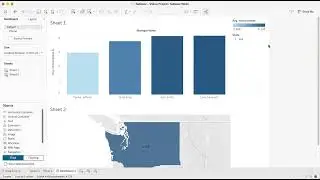
1:48-2:00 Show Me Options
2:00-2:24 Show Me Bar Chart
2:24-2:31 Conclusion
Throughout this video you’ll better understand the three ways to create a Bar Chart using the
Tableau 2024.1 version.
About Us: The Vandal Analytics Youtube Channel includes bite-sized, student- created, hot-to
videos for that moment when you are using Tableau, Python, or Excel, or preparing to perform
interviews or a journey mapping exercise and need a simple reminder about how to perform a
task. Learn more about Vandal Analytics and the University of Idaho’s College of Business and
Economics.
#Tableau #barchart #datasort #analytics #tableaututorial