21-Creating a Bar Chart2
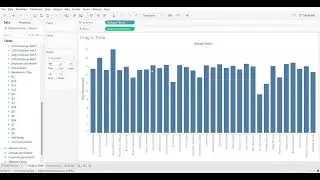
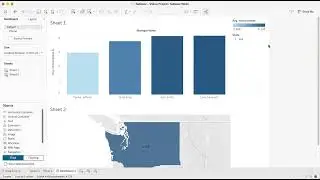
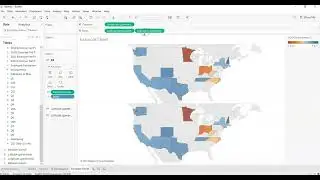
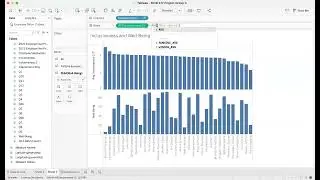
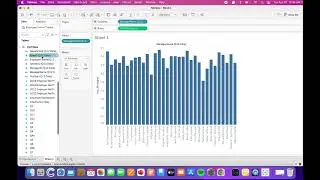
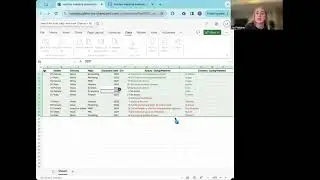
Video Description: In this video I will go over how to make a bar chart using the Tableau Software.
Here is what we will cover in this video:
[0:00]: [Intro]
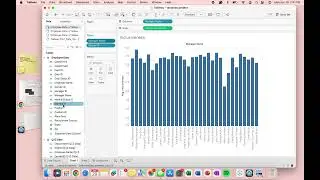
[0:20]: [Columns and Rows]
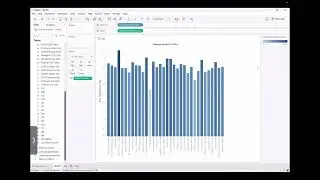
[0:55]: [Pill Measure]
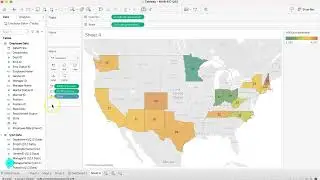
[1:15]: [Color]
[2:05]: [Data Sorting]
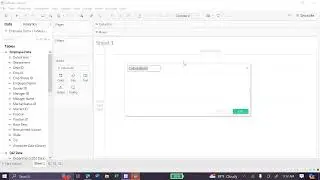
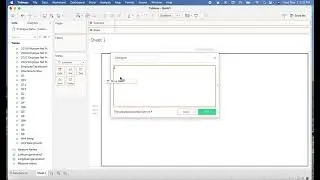
[2:45]: [Title]
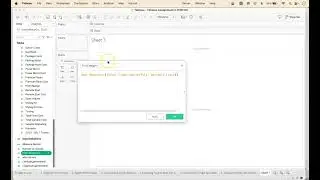
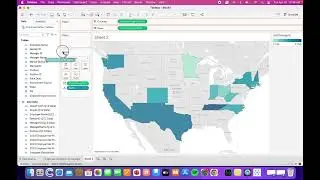
[3:15]: [Filters]
[4:20]: [Conclusion]
By the end of this video, you will be able to create a bar chart and make it more presentable by changing its appearance such as the colors, filters and title.
About us:
The Vandal Analytics YouTube Channel includes bit-sized, student-created, hot-to videos for the moment when you are using Tableau, Python, or Excel, or preparing to perform interviews or a journey mapping exercise and need a simple reminder about how to perform a task. Learn more about Vandal Analytics and the University of Idaho’s College of Business and Economics.
#Tableau #Barchart #UofI #TableauTutorial