19-Graph
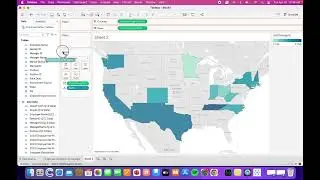
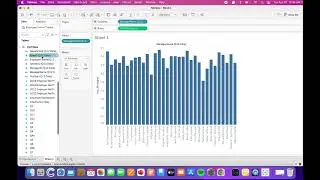
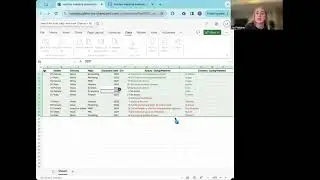
In this video, we will be going over how to add well-being and how to format your tableau tables. Specifically, the video focuses on the following:
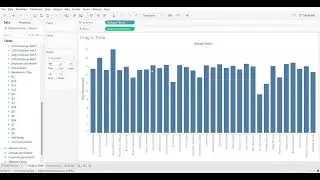
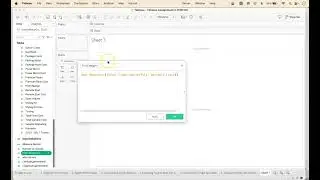
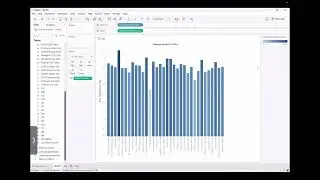
● 0:08-0:26 Explanation of how to add well-being to the table
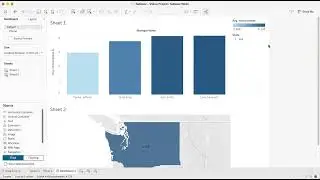
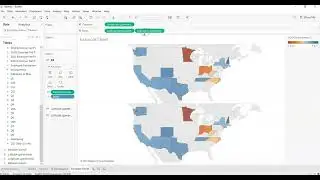
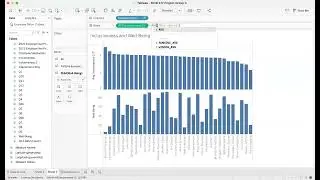
● 0:26-0:44 How to pick what graph you want
● 0:44-0:59 How to sort from highest to lowest or lowest to highest
By the end of this video, you’ll be caught up on how to add well-being and how to format your tableau tables.
About Us:
The Vandal Analytics YouTube Channel includes bite-sized, student-created, how-to videos for that moment
when you are using Tableau, Python, or Excel, or preparing to perform interviews or a journey mapping
exercise and need a simple reminder about how to perform a task. Learn more about Vandal Analytics
and the University of Idaho’s College of Business and Economics.
#tableau #well-being #format #tables #highesttolowest #lowesttohighest