Gantt Charts for Agile Project Management 🏃 Excel vs. MS Project, Primavera P6, Trello & ClickUp
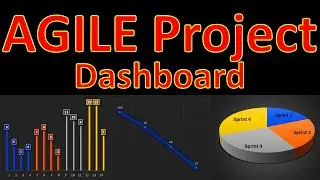
Gantt Diagrams for Agile Project Management in developing a minimum viable product! This step-by-step tutorial by Dr. Mehrdad Arashpour, animates Gantt Charts for visualizing sprint cycles, milestones, and dependencies between tasks. By watching this video, you will learn how to:
• Draw Excel Gantt Charts for Agile Project Management,
• Define Project Milestones, Tasks & Risk Levels,
• Track Project Progress & Make Data-Driven Decisions
• Compare Excel Gantt Diagrams with MS Project, Primavera P6, Trello & ClickUp
❎ Excel workbook to follow along: https://forms.gle/zm2c1FfV4gmbNTYL8
⌛ TIMESTAMPS
0:00 - Introduction to Project Time Management Using Gantt Charts
0:10 - Excel’s Dynamic Template for Gantts, Defining Project Milestones, Project Progress Tracking, & Comparing Gantts in Different Software
0:29 - Step 1 (Setting up Gantt Charts for Agile Project Management)
2:08 - Step 2 (Defining Project Milestones, Tasks & Risk Levels)
4:38 - Step 3 (Project Progress Tracking & Data-Driven Decision Making)
9:38 - Step 4 (Comparing Excel Gantt Diagrams with MS Project, Primavera P6, Trello and ClickUp)
13:00 - Excel for Animating Gantt Charts
💯 Related Videos: Dynamic Gantt Charts: • Easy 3D Gantt Charts in Excel (4 minu...
Gantt Charts for Time Management: • Gantt Charts for time management - Fi...
✍ Request Next Tutorial Video: https://forms.gle/Frz9U9imCouofdoD8
🔔 Subscribe: https://bit.ly/EngineeringManagementA...


