Agile Project Management in EXCEL (2 Minutes!!!)🏃 Burndown Chart, Sprint Allocation & Scrum Master
In this video of #engineeringmanagementacademy #AgileMethodology is tutored for #ProjectManagement by #DrMehrdadArashpour
🔔 Subscribe: https://bit.ly/EngineeringManagementA...
❎ Excel workbook to follow along: https://bit.ly/Agile_Project_Excel
🆕 Other Excel Tutorials: https://bit.ly/PM_Excel_Academy
⌛ TIMESTAMPS
0:00 - Introduction to the Agile Methodology in Excel
0:05 - Excel’s Dynamic Template for Scrum Master → Sprint Planning, Sprint Allocation, & Drawing Burndown Chart in Agile Project Management
0:23 - Step 1 (Sprint Planning based on Work Velocity Forecasts)
1:13 - Step 2 (Sprint Allocation based on Backlog of User Stories)
1:41 - Step 3 (Drawing Burndown Charts for Remaining Story Points After Sprints)
2:18 - Concluding Remarks
❓ Request Next Tutorial Video: https://forms.gle/Frz9U9imCouofdoD8
Did you know Excel can be used to plan agile sprints or time-boxed iterations in Project Management? In this video, We’ll create & share a lightweight agile framework in Excel with 3 easy steps: Sprint Planning based on work Velocity Forecasts, Sprint Allocation based on the Backlog of User Stories, & Drawing Burndown Charts for Remaining Story Points After Sprints. You can follow along by getting the Excel workbook via the provided link in the description below. https://bit.ly/Agile_Project_Excel
Step 1 is Sprint Planning based on Work Velocity
Our case study focuses on a development team with a backlog of 16 user stories. Based on work volume & complexity, our scrum master has assigned Story points. Our aim as the Product Owner is to plan 4 sprints to clear the work backlog of 120 points. Initial work velocity forecasts are made based on our team's capacity. The development team improves its performance in later sprints by becoming more familiar with project processes. In real projects, a combination of improved productivity & additional overtime work can contribute to velocity increase. The final work velocity is found by applying velocity increase percentages. For example, final Velocity of Sprint 2 will be 20×(1+20%), which is 24 story points. We can find the Total story points completed at the end of each sprint by summing up final velocities.
Step 2 is Sprint Allocation based on the Backlog of User Stories
We now need to allocate story points or work backlog to each sprint based on the relevant velocity. For example, if Sprint 1 can handle 20 story points, we can allocate stories 1 to 4 whose points sum to 20. In the same way, we can allocate backlog work to sprints 2, 3 & 4. Our planning for 4 sprints can clear the work backlog for user stories 1 to 14. Stories 15 & 16 will be the remaining backlog after the 4 sprints.
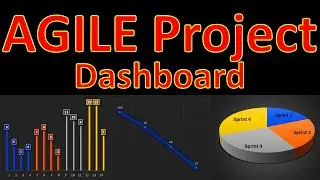
Step 3 is Drawing Burndown Charts for Remaining Story Points
We can easily draw Burndown Chart for the project to show remaining story points after each sprint. This visualizes team's progress towards completing work backlog by the 4 planned sprints. Remaining points after sprint 1 is 120 minus 20, which is 100. We can duplicate the formula to find the remaining points of 76, 46 & 13 after the later sprints. A line graph can be used to plot the burndown chart. We can customize the style to suit our project reports.
And here it is, an easy & short implementation of Agile Methodology using only 3 simple steps in Microsoft Excel.
If you found this video useful, please remember to like & consider subscribing. I hope to have your comments & see you in the next one.