Critical Chain Project Management 🔗 CCPM 🔗⛓ 4 Minutes in EXCEL!! Critical Path Method (CPM) Goldratt
In this video of #engineeringmanagementacademy #CriticalChainProjectManagement developed by #EliyahuGoldratt is tutored by #drmehrdadarashpour → #CCPM
🔔 Subscribe: https://bit.ly/EngineeringManagementA...
❎ Excel workbook to follow along: https://bit.ly/CCPM_
💯 Related Videos: Critical Path: • Easy 3D Gantt Charts in Excel (4 minu...
Gantt Chart: • Easy 3D Gantt Charts in Excel (4 minu...
⌛ TIMESTAMPS
0:00 - Introduction to Critical Chain Project Management in Excel
0:08 - Excel’s Dynamic Template, Replacing Schedule Padding with a Project Buffer, Tracking buffers Consumption & Project Progress by Fever Charts, & Creating Feeding Buffer & Resource Buffer to Manage Uncertainty
0:23 - Step 1 (Replacing Schedule Padding with a single Project Buffer)
1:27 - Step 2 (Tracking Buffer Consumption & Project Progress by Fever Charts)
3:09 - Step 3 (Creating Feeding & Resource Buffers to Manage Uncertainty)
4:06 - CPM vs CCPM
✍ Request Next Tutorial Video: https://forms.gle/Frz9U9imCouofdoD8
You’ll be surprised that Excel can handle Critical Chain Project Management or CCPM! In this video, We’ll create & share a Dynamic Template in Excel with 3 easy steps: Replacing Schedule Padding with a Project Buffer, Tracking Buffer Consumption & Project Progress by Fever Charts, & Creating Feeding & Resource Buffers to Manage Uncertainty. You can follow along: https://bit.ly/CCPM_
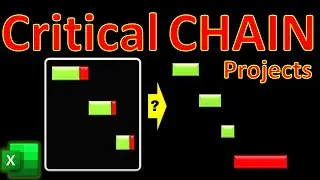
Step 1 is Replacing Schedule Padding with a single Project Buffer
Our case study focuses on a project with duration estimates for its eight activities. Due to existing uncertainty, a safety margin or extra time is considered for critical activities. For example, activity A’s duration has been padded with a buffer of two days. Using critical path method or CPM we can find activity finish dates & also project completion on day 48. We can use these dates to draw a Gantt chart to visualize the timeline. Considering this base case, Our aim is to gain more efficiency using Critical Chain Project Management or CCPM. Eliyahu Goldratt developed that based on the Theory of Constraints or TOC. To manage project bottlenecks, arbitrary schedule paddings are integrated into a single project buffer to prevent activities from taking longer than necessary, which is known as Parkinson’s Law. In our project, the second Gantt chart animates this concept. Project buffer also addresses Student Syndrome or starting activities at the last possible moment. If you want to implement CPM in Excel or draw Gantt Charts, the video links are provided ↑.
Step 2 is Tracking Buffer Consumption & Project Progress by Fever Charts
Creating a Fever Chart in Excel is a proactive tool for risk management to monitor buffer consumption relative to project completion in CCPM. Milestones in real projects should represent stages where significant progress or evaluation occurs.
We should monitor project activities at each milestone & record buffer consumption based on the site data. We can find buffer consumption for other milestones using the site reports. For plotting, select Completion % & Buffer Consumption columns. Insert Scatter Plot with straight lines & markers. Feel free to adjust the style to suit your project reports. Desirable region on this chart is close to horizontal axis, where maximum completion is achieved with minimum buffer consumption. Undesirable region is close to vertical axis, where min progress is made with max buffer. Color code both regions. Right-click & select the format chart area. Choose gradient fill, select Linear Type & choose the desirable direction. Make sure there are two gradient stops & choose contrastive colors like green & orange. If the trend line enters the Orange Zone, it’s a signal that corrective actions may be needed to get the project back on track. The Green Zone indicates efficient progress relative to buffer usage.
Step 3 is Creating Feeding & Resource Buffers to Manage Uncertainty
Feeding Buffers protect the critical chain by adding extra time to non-critical paths that connect to it. In our project, two non-critical activities, C and E, connect to Activity F in the critical chain. Activity C has a duration of 4 days & Activity E has a duration of 8 days. The total duration of these activities is 12 days. In CCPM, a Feeding Buffer is typically set at around 50% of the non-critical path duration. This safeguards for any delays in non-critical activities & consequent impact on the critical chain.
Resource buffers ensure that resources required for activities on the critical chain are available. A Resource Buffer serves as a prompt to ensure resources are available & prevent bottlenecks without extending the project timeline
While the Critical Path identifies the longest sequence of dependent tasks, Critical Chain Project Management or CCPM considers resource availability and reduces inefficiencies caused by multitasking and other delays.
Here—an easy & short implementation of CCPM using only 3 simple steps in Microsoft Excel.