Multivariate Analysis in EXCEL🦺🚧 Safety Risk Predictions in Project Management & Occupational Health
In this video of #engineeringmanagementacademy #multipleregression is tutored for #riskmanagement by #drmehrdadarashpour
🔔 Subscribe: https://bit.ly/EngineeringManagementA...
❎ Excel workbook to follow along: https://bit.ly/Multiple_Regression_Pr...
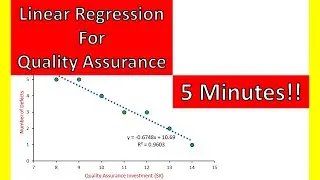
▶ RELATED VIDEO: • Linear Regression in 5 minutes! → 4 E...
⌛ TIMESTAMPS
0:00 - Introduction to Multivariate Analysis in Excel
0:06 - Excel’s Dynamic Template, Multiple Regression in Data Analysis Tools, LINEST Function, Combo Charts with Clustered Columns
0:26 - Step 1 (Identifying Variables & Using Data Analysis Tools for Multiple Regression)
1:22 - Step 2 (Interpreting Multiple Regression Results in Excel)
2:54 - Step 3 (Using INDEX(LINEST) Function for Multivariate Analysis)
3:53 - Step 4 (Analyzing Observed versus Predicted Safety Risks by Plotting Combo Charts with a Clustered Column)
4:53 - Concluding Remarks
✍ Request Next Tutorial Video: https://forms.gle/Frz9U9imCouofdoD8
🌱 Other Excel Tutorials: https://bit.ly/PM_Excel_Academy
Excel’s multivariate analysis can forecast safety risks in project management? In this video, we’ll create & share a dynamic Template in Excel for multiple regression using several methods: Excel’s Data Analysis Toolpak, INDEX(LINEST) Function for Multivariate Analysis & Analyzing Observed versus Predicted Safety Risks by Plotting Combo Charts with Clustered Column. You can follow along by getting the Excel workbook via the provided link: https://bit.ly/Multiple_Regression_Pr...
Step 1 is Identifying Variables & Using Data Analysis Tools for Multiple Regression
Our case study includes 10 projects with observations on the number of safety risks, safety induction hours per worker, night shifts & Safe Work Method statements. Seemingly, there is a meaningful relationship between the number of safety risks & other 3 variables. To investigate this, we should first activate the free ‘Data Analysis’ add-on to Excel. Click on ‘Data analysis’ & select ‘Regression’ from the list. ‘Input Y Range’ is the dependent variable, which is the column related to ‘observed safety risks’ in our example. ‘Input X Range’ defines independent variables, which are the columns related to Safe Work Method statements, night shifts & safety induction hours. We must check the box for ‘labels’ as we have selected column headings.
Step 2 is Interpreting Multiple Regression Results in Excel
Multiple R or the correlation coefficient, which is 0.9549 suggests a strong positive relationship between variables. R Square, or the coefficient of determination, means that 91.19% of variability in the number of safety accidents can be explained by our 3 independent variables. The standard error suggests that the predicted number of safety risks deviates from the actual observation.
Under ANOVA or Analysis of Variance, a high F-statistic value of 20.7049 rejects this null hypothesis. Significance F or p-value of 0.0014 is much smaller than the common alpha level of 0.05 & shows that our regression model is statistically significant.
Based on the coefficients, the multiple regression equation is: Number of Safety Risks = 2.6776 – 0.2074 * (Safety induction hours) + 0.3350 * (No. of Night Shifts) - 0.0225 * (Safe work method statements). However, Considering p-values, we can simplify the multiple regression model by excluding independent variables with p-values greater than 0.05. In our example, we can exclude Safe Work Method Statements with P-value of 0.7875.
Step 3 is Using INDEX(LINEST) Function for Multivariate Analysis
We can numerically calculate coefficients & the intercept of our multiple regression model using INDEX(LINEST) Function. Select a cell for c1 or coefficient of the first independent variable, which is Safe Work Method Statement & insert the INDEX(LINEST) function. The first argument is known_ys, which is number of safety risks in this example. The 2nd argument after the comma or known_xs are values of our 3 independent variables. Remember to set the last argument equal to 1 for the first independent variable, which is Safe Work Method Statement. To calculate c2 or coefficient of the 2nd independent variable, set the last argument of INDEX(LINEST) to 2. Finally, we can calculate the intercept of our multiple regression by setting the last argument of INDEX(LINEST) to 4.
Step 4 is Analyzing Observed versus Predicted values by Plotting a Combo Chart
We can predict the number of safety risks using our model. The predicted number of safety risks in our first project will be 0.92. We can generate predictions for all 10 projects by replicating the formula. Go to the Insert tab & In the Charts group, select Line with Markers. We can improve visualization for project reporting by creating a combo chart. Set the observed Number of safety risks to Clustered Column. Combo charts show issues of Overestimation & Underestimation.
And here it is, an easy & short implementation of multiple regression in Microsoft Excel.