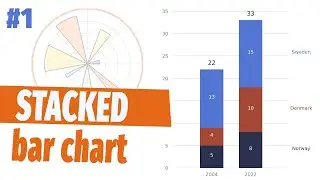
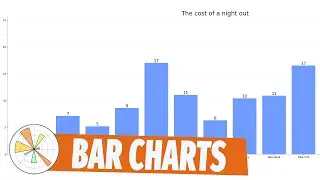
Matplotlib #2: Bar charts
Bar charts in matplotlib are easy to make but to add the data labels is a bit more tricky.
Lets go through the bar chart plotting basics in this video
Here you can download the power bi file used in the video:
Go to:https://curbal.com/donwload-center
Click on community downloads and get the file (same number as title)
To learn more about Power BI, subscribe to my Power youtube channel here: / @curbalen