Extract colors from an element in your visualization for re-use | Extract colors with Python
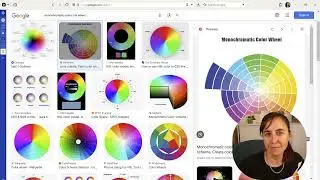
In this video I am going to show you how you can extract the colors from an element in your data visualization, so you can use it elsewhere in your visual.
Get the code here:
https://curbal.com/curbal-learning-po...
Chapters:
00:00 Intro
00:37 Import the colors and the images
01:40 Convert the colors to RGB pixels and the the frequency
02:20 Store the RGB colors in a dataframe and pick the ones I want
05:15 Convert the RGB to HEX
05:50 Plot the colors with Matplotlib
06:00 Add a complementary color to list of colors
Resources mentioned in the video:
https://curbal.social/@democracy
https://www.canva.com/colors/color-wh...
Here you can download the power bi file used in the video:
Go to:https://curbal.com/donwload-center
Click on community downloads and get the file (same number as title)
To learn more about Power BI, subscribe to my Power youtube channel here: / @curbalen