8 тысяч подписчиков
66 видео
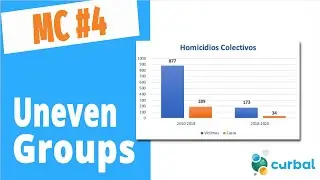
Misleading charts #4: Uneven grouping of data
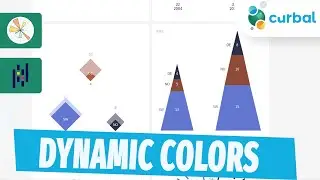
Extract colors from an element in your visualization for re-use | Extract colors with Python
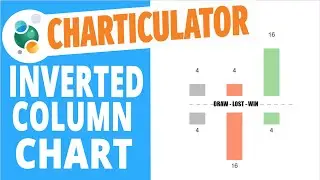
Charticulator #10: How to create an Inverted column chart
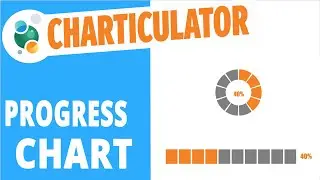
Charticulator #19:How to create Progress charts
Charticulator #13: How to create a bar and column chart
Charticulator lives on as a community project!!
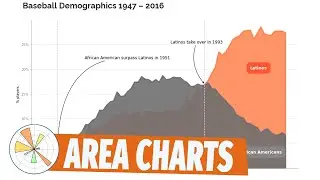
Matplotlib #1: Area charts
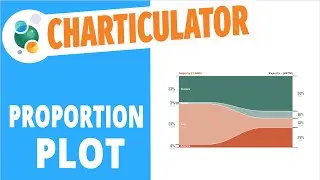
Charticulator #12: How to create a Proportion plot
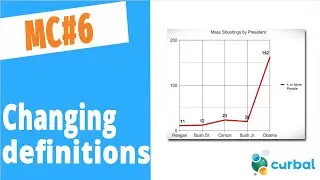
Misleading charts #6:Changing the kpi definition
CBC #3: Get the book details for each book
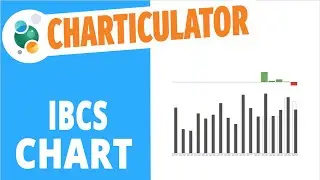
Charticulator #25: How to create IBCS charts
1 dataset 100 matplotlib visualizations
CBC #2: Get a list of recommended books on goodreads | Python Book project
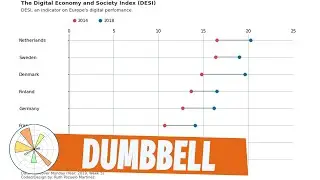
Matplotlib #4: Dumbbell charts
Dynamically assign colors in pandas and matplotlib
Do a google image search with python!
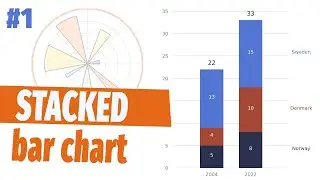
Viz 1 - 1 dataset, 100 matplotlib viz : Stacked bar chart
CBC 4#: I am stuck!
Charticulator #25: How to create peacock chart
Charticulator #2: Create a Radial bar chart
Remove monochromatic colors (too similar colors) with python | Create a color picker Part 3
Charticulator #8: How to create a Dumbbell chart
Charticulator #14: How to create a bullet chart
Face detection using python
Charticulator #1: How to create a radial column chart
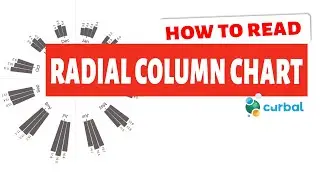
H2R #3: How to read a radial column chart
Charticulator #16: How to create a matrix Chart
Charticulator #7: Create a Sankey chart without writing any code
Charticulator #22: How to create an area chart
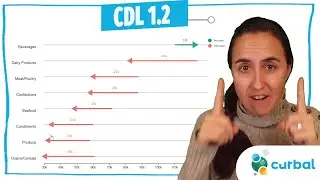
CDL #1.2 : Comparing two or more variables with a modified dumbbell chart
Misleading charts #2: Poor labelling on Axis
Misleading Charts #8: Always check the source
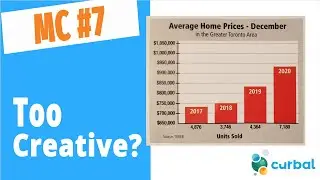
Misleading charts #7: Get too creative with your chart
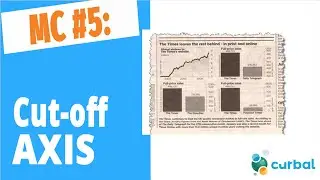
Misleading charts #5: Cutting off Y-Axis
Update on this channel | RIP charticulator
Charticulator #18: How to create Pie and donut charts
Charticulator #24: How to create a waffle chart
Charticulator #21: How to create a radar chart
Charticulator #26: How to create a Lollipop chart
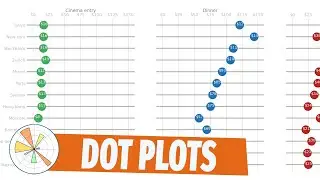
Matplotlib #3: Dot plots
Charticulator #11: How to create a line chart and conditional format it.
CBC #1: What should I read next? | A new python project
CDL#1-Into: Ways to compare two or more variables in data visualization - Announcement
Misleading Charts #9: Is Chile's vaccination rate slowing down?
Charticulator #17: How to create a Gantt chart
CDL# 1.1-Compare variables using modified bar charts
Charticulator #9: How to create a Cycle plot
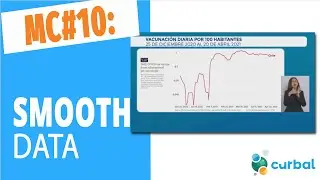
Misleading Charts #10: Smoothing the data
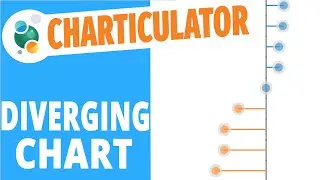
Charticulator #15: How to create a diverging Lollipop chart
How to pick two dominant colors from an image using python | Part 2