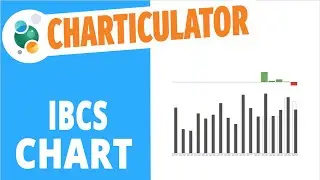
In todays video I am going to show you how to create and inverted column chart. Not sure if that is what it is called but it certainly looks like it ;) To learn more about Power BI, subscribe to my Power youtube channel here: / @curbalen
Как «узник космоса» Сергей Крикалев переждал распад СССР на орбите
Empyrion Galactic Survival БАГИ и ЧИТЫ Стрельба сквозь текстуры и блоки
10 Best Hotels Right on the Beach in Phu Quoc . Phu Quoc Island’s MosPopular Beachfront Hotels
Create Stunning PowerPoint Presentations in Just 3 Minutes with SlidesAI.io! in hindi
How to Find Workspace Settings on Notion
One of my best real estate deals im proud of
Git clone. key_load_public: invalid format Permission denied (publickey)
Soft honey homemade gingerbread with glaze - the taste of childhood!
Viz 1 - 1 dataset, 100 matplotlib viz : Stacked bar chart
Dynamically assign colors in pandas and matplotlib
1 dataset 100 matplotlib visualizations
CBC 4#: I am stuck!
CBC #3: Get the book details for each book
CBC #2: Get a list of recommended books on goodreads | Python Book project
CBC #1: What should I read next? | A new python project
Remove monochromatic colors (too similar colors) with python | Create a color picker Part 3
Face detection using python
Do a google image search with python!
How to pick two dominant colors from an image using python | Part 2
Matplotlib #4: Dumbbell charts
Matplotlib #3: Dot plots
Matplotlib #2: Bar charts
Matplotlib #1: Area charts
Extract colors from an element in your visualization for re-use | Extract colors with Python
Charticulator lives on as a community project!!
Update on this channel | RIP charticulator
Charticulator #25: How to create IBCS charts
Charticulator #24: How to create a waffle chart
Charticulator #25: How to create peacock chart
Charticulator #23: How to create an Infographic chart
Charticulator #22: How to create an area chart
Charticulator #21: How to create a radar chart