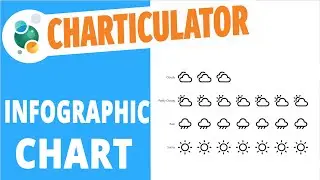
Charticulator #23: How to create an Infographic chart
Charticulator allows you to build charts using icons or gifs. In this video I will show you how to do that.
Here you can download the power bi file used in the video:
Go to:https://curbal.com/donwload-center
Click on community downloads and get the file (same number as title)
To learn more about Power BI, subscribe to my Power youtube channel here: / @curbalen