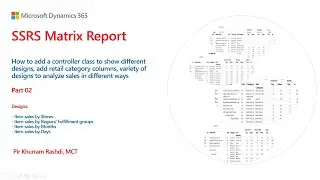
How to add a controller class for different designs to analyze retail sales in D365 Finance
In the retail industry, the main focus of the sales and marketing department is to analyze the sales data to attract customers to increase sales in a variety of ways. Until you have the right tools or reports, it seems quite difficult to achieve the objective. The video demonstrates how to add a controller class to show different designs to analyze retail sales in various ways in Dynamics 365 Finance. The retail category and sub-categories are added as columns and additional joins implemented in the Data provider class. The enum is used as a parameter or filter for the end-users to run a different design of the report. A controller class is added to run a specific design based on the user's preference. Once the business logic is implemented in the Data provider class it is easy to showcase the sales data in a variety of ways.
Designs added:
Item sales by Stores
Item sales by Region/ Fulfillment groups
Item sales by Months
Item sales by Days
Code:
https://github.com/pkrashdi/d365fo/bl...
Excel Sample:
https://github.com/pkrashdi/d365fo/bl...
https://github.com/pkrashdi/d365fo/bl...
https://github.com/pkrashdi/d365fo/bl...
https://github.com/pkrashdi/d365fo/bl...
About Trainer:
I am a certified Microsoft Trainer (MCT) and consultant manager in Microsoft Dynamics 365 FinOps, SAP S/4 Hana, Power platform, SharePoint, Azure, and Oracle Cloud with over 20 years of global experience in supporting industries as textile, manufacturing, retail, heavy equipment rental, transportation, facility management, building material, construction, and telecom infrastructure. Besides, I also support open-source software for digital needs.
Contact:
👉 E-mail: [email protected]
👉 GitHub (Source codes): https://github.com/pkrashdi
👉 LinkedIn: / khurramrashdi
🔔 Subscribe to get notified for newly released videos: https://youtube.com/pirkhurramrashdi?.... Also, spread the knowledge by sharing videos.
🎬 Weekly at least two videos are released at appropriate times.
📝 SUPPORT AND GET MORE VIDEOS BY WATCHING ON YOUTUBE, INSTEAD OF DOWNLOADING.