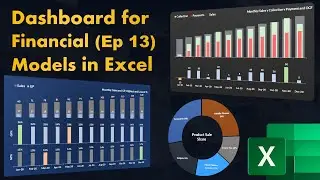
Excel: Fully Dynamic Dashboard for Financial Models - Sales Distribution Donut Chart Ep 12
📺 Excel: Fully Dynamic Dashboard for Financial Models Playlist here • Excel Dashboard : Fully Dynamic Dashboard ...
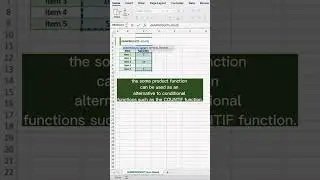
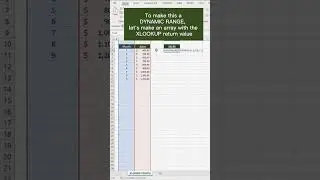
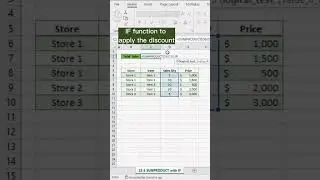
In this episode, You will learn how to prepare Sales Distribution Donut Chart showing each products contribution to overall sales of the company/business
🖥 Full Video Course on How to Build the financial Model step by step and Build Robust Financial Forecasting Models for your startup https://www.udemy.com/course/build-a-...
📔 Read about the Financial Model template (download) and course on my website and also get free EBOOK https://www.exactprobi.org/get-a-uniq...
📥 Excel File Downloads for the Dashboard https://www.exactprobi.org/excel-stor...
Excel is a powerful tool to build customised visualisation and the learning curve of mastering visual in Excel is not that difficult! In this video series, I will be teaching you how to create a fully dynamic dashboard (not interactive) step by step. New Episode each week!
This video series is part of my Video course: Build a Unique Financial Forecasting Model in Excel for your next startup or existing business! Link is available above to enrol (try free preview videos)
If you would like to followup along with me, the files are available here to download: Coming soon
Let me know if you have any comments or query in below, I will happy to answer them
Cheers
======================================================
Website: https://www.exactprobi.org/
Subscribe to my newsletter for a FREE copy of Amazing PRO Excel tip/tricks book: https://www.exactprobi.org/excel-stor...
Subscribe to my Channel here http://bit.ly/SubToExAC
Like My Facebook Page here / exaccounting
Linkedin Profile / proprashant
Udemy Courses (reach out to me for special discounts) https://www.udemy.com/user/prashaant-...
Amazon Books Store (awesome Excel and data modelling books) https://www.amazon.com/shop/prohdgami...


![Mastering Month End Closing - Top 20 Excel Functions [FREE Download]](https://images.mixrolikus.cc/video/UU85j3yaR3A)