Line Chart | Level UP 📈
No sound just Video!
Thanks first to • One Chart - Two Insights! Power BI Li... for the original Idea!
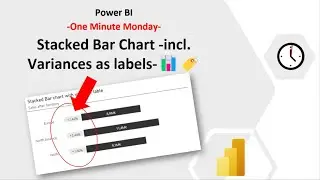
Line Chart with variances as bars on top
Chart Type: Line Chart
Measures we need: Revenue, PY, Revenue - PY, Above Target Line, Below Target Line, Pos Line, Neg Line, Y1 Max Line, Y2 Min Line
X-axis: Year, MonthName
Y-axis: Revenue, PY
Secondary x-axis: Pos Line ( △AY/PY), Neg Line
1) Y-axis - Range - Maximum: (fx) Y1 Max Line (after turn off Title and Y-axis)
1.1) X-axis: turn off Title
2) Secondary Y-axis - Range - Minimum: (fx) Y2 Min Line (after turn off Title and Seconday X-axis)
2.1) Legend: off
3) Line- stroke width: 1px (all), Neg Line: 0 px, Pos Line: dashed, light grey
4) Marker
Pos Line/Neg Line: off
Revenue/PY: size 4
5) Error Bars
Pos Line - Upper Bound: Above Target
-Color: green /Width: 10
Labels: on
Neg Line - Lower Bound: Below Target
-Color: red/ Width: 10
Labels: on
Measures as always stored in my GitHub: https://github.com/K-Borchert/Power_B...