Book Review: The Visual Display of Quantitative Information by Edward Tufte
Description
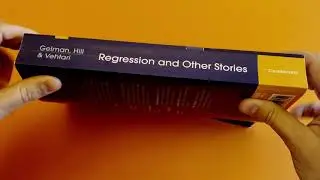
In this video, we're reviewing Edward Tufte's book, The Visual Display of Quantitative Information. Tufte is a renowned statistician and graphic designer, and this book is a classic on the subject of graphic presentation of data.
Script:
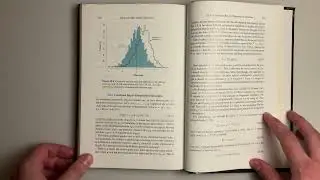
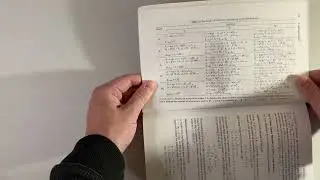
I picked up The visual display of quantitative information by Edeward Tufte years ago from a used book store. It is a book I did not like the first time I read it. I thought most of the advice was common sense. Over the years I have opened it up time and time again. I think this is because in my profession I am called on to present quantitative information. To make sure my graphics are effective I check it against the principles outlined in this book. Chart junk, data-ink, small multiples are all valuable principles to review from time to time.
This book has gone from being an initial lukewarm read to a time-tested treasure.
XVZFTUBE ONLINE:
🕸️ https://xvzf.bearblog.dev/tools/
📁 GitHub: https://github.com/xvzftube
FREE AND OPEN SOURCE SOFTWARE THAT I CURRENTLY USE:
📽️ FFmpeg|LGPL: ............. https://ffmpeg.org/
🎵 Audacity|GPL: ............ https://www.audacityteam.org/
🗒️ Neovim|Apache 2.0: ....... https://neovim.io/
R R|MIT: ................... https://www.r-project.org/
🐍 Python|Python: ........... https://www.python.org/
🪶 SQLite|Public Domain: .... https://www.sqlite.org/index.html
🦆 DuckDB|MIT: .............. https://duckdb.org/
🍥 Debian|GPL: .............. https://www.debian.org/


![Lightning-Fast Setup: Get VS Code & Python Up and Running in No Time [Windows | 2023]!](https://images.mixrolikus.cc/video/EdxAUXXGB_M)