Joint Strength And Statistics
00:00 - Intro
01:51 - Trimmed Means
04:27 - Dovetail vs butt joint with only 5 samples
08:46 - Glue starved hypothesis
*Inspiration For Video*
@ScottWalshWoodworking
• This Simple Joint is Stronger Than a ...
*Data*
https://github.com/xvzftube/joint_str...
*Description:*
📊 *Unlocking the Secrets of Joint Strength: A Statistical Analysis Journey*
🔍 This episode was born from a captivating comment I stumbled upon in the YouTube comments section of Scott Walsh's woodworking video on joint strength comparison. The comment delved into statistical analysis, questioning the efficacy of comparing averages alone and whether removing max/min values was justified. Intrigued, I explore these questions, aiming to demystify statistical analysis for all curious minds on YouTube.
📏 *Background:*
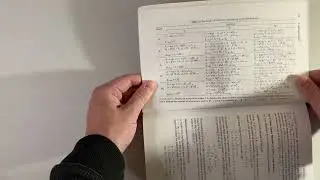
Before diving into statistical intricacies, I provide a brief overview of Scott Walsh's joint strength tests. The focus is on three key points:
1. The exclusion of max/min values from the average.
2. The interpretability of the data with only five samples per joint.
3. Determining the ideal sample size for a follow-up test on the glue-starved hypothesis.
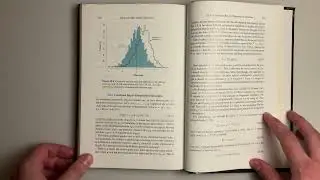
📈 *Trimmed Means and Data Interpretation:*
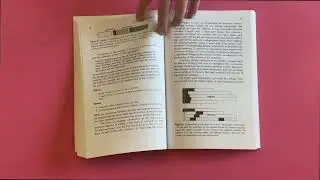
Addressing whether excluding max/min values from the average was a bad idea, I discuss the importance of the trimmed mean and why it's a fitting choice in this context. Additionally, I touch on alternatives like Windsorized mean, emphasizing the need to maintain transparency by sharing all data.
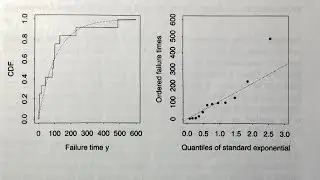
🔍 *Statistical Testing with Permutation Tests:*
Exploring what can be tested with the data, I introduce permutation tests as a powerful tool for data analysis. Through a hypothetical scenario comparing two joint types, I demonstrate how to calculate p-values and challenge assumptions around normality and sample size.
📊 *Sample Size Determination:*
Concluding with insights into determining sample sizes for hypothesis testing, I discuss the implications of statistical power and how it influences the ability to detect true effects. Practical tips are shared for those interested in conducting their own experiments.
📈 *Simplified Statistical Analysis:*
This video aims to make statistical concepts accessible, particularly for those not well-versed in statistics. Forget complex formulas; I show you how computers can simplify statistical analysis, empowering you to explore and interpret your own data.
📚 *Further Learning:*
For a deeper dive into statistical concepts like hypothesis tests and p-values, check out my video titled "P-Values, Beer, and Mosquitoes." Let's unravel the mysteries of data analysis together!
👀 *Audience:*
This content is designed for anyone on YouTube curious about statistical analysis and its applications. Whether you're a hobbyist woodworker or just interested in exploring the world of data, this video is for you!
🙏 *Thank you for watching!* Your engagement, questions, and insights are invaluable to fostering an open dialogue on statistical analysis. If you found this content helpful, consider subscribing for more insights into the fascinating world of data analysis. Let's keep the conversation going! 🔍📊🔍


![TitoM and Yuppe - Disturb My Peace [Ft. LastBornDiroba, Xduppy and TmanXpress] (Official Audio)](https://images.mixrolikus.cc/video/1W-AdFcOBgk)


![Lightning-Fast Setup: Get VS Code & Python Up and Running in No Time [Windows | 2023]!](https://images.mixrolikus.cc/video/EdxAUXXGB_M)