Average Shifted Histogram
Average Shifted Histograms are a great way to get non-parametric density estimation. By shifting and averaging multiple histograms together, we can get a better understanding of the underlying distribution of the data. Whether you are a beginner or an experienced data scientist, this video will provide valuable insights on how to use average shifted histograms in your own analyses.
Code is here:
https://gist.github.com/xvzftube/3bc3...
Rule of Thumb For Picking "m":
If the number of points is less than or equal to 100, the default value is 4.
If the number of points is less than or equal to 1,000, the default value is 8.
If the number of points is greater than 1,000, the default value is 16.
Source: https://www.itl.nist.gov/div898/softw...
Script:
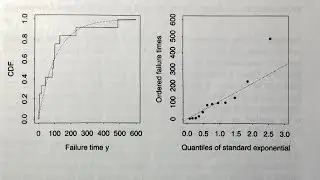
Okay, this is just a short art video on density estimation. The go-to method for density estimation is KDE, but this is an alternative called average shifted histograms. Most of the time, this is going to be as accurate as you need, but it's also a little more computationally efficient compared to KDE. It's a non-parametric method, and I just wanted to give a high-level overview of this method. I'm not going to go over every line of the script. I actually got this script from a book called 'Statistical Computing with R.' All I wanted to show is what the smoothing looks like and how average shifted histograms work at a high level. I'm just going to source this script.
The main parameter that controls the smoothing is M. This is how many shifted histograms are being averaged over. So when M equals one, the average shifted histogram line is shown in this tomato color, and it outlines a standard histogram. Now, if I change that parameter to two, at the midpoint of those bins, there's some averaging going on, so things are broken up a little bit into two histograms that are now a little bit offset. Maybe something that might be a little more realistic is 14. It's a little on the low side still, but you start to see the smoothing happening and a nice non-parametric density being built. I've heard of some people going up to 40 on the smoothing parameter. There's always a trade-off with going a little too high. Let's see what 40 looks like. Yeah, that looks pretty smooth. This is the average shifted histogram, and it is a fantastic, computationally efficient, reliable method for estimating densities. I hope you enjoyed watching this video and we will see you next time.
XVZFTUBE ONLINE:
🕸️ https://xvzf.bearblog.dev/tools/
📁 GitHub: https://github.com/xvzftube
FREE AND OPEN SOURCE SOFTWARE THAT I CURRENTLY USE:
📽️ FFmpeg|LGPL: ............. https://ffmpeg.org/
🎵 Audacity|GPL: ............ https://www.audacityteam.org/
🗒️ Neovim|Apache 2.0: ....... https://neovim.io/
R R|MIT: ................... https://www.r-project.org/
🐍 Python|Python: ........... https://www.python.org/
🪶 SQLite|Public Domain: .... https://www.sqlite.org/index.html
🦆 DuckDB|MIT: .............. https://duckdb.org/
🍥 Debian|GPL: .............. https://www.debian.org/


![TitoM and Yuppe - Disturb My Peace [Ft. LastBornDiroba, Xduppy and TmanXpress] (Official Audio)](https://images.mixrolikus.cc/video/1W-AdFcOBgk)


![Lightning-Fast Setup: Get VS Code & Python Up and Running in No Time [Windows | 2023]!](https://images.mixrolikus.cc/video/EdxAUXXGB_M)