What are Covered Call Options?
#tradingstrategy #calloption #optionstrategy #howto #memes
Learn how to earn passive income from stock market through covered calls!
Check out intrendias.com for free buy and sell signals.*
A covered call option is a popular strategy used by stock investors who already own shares of a particular stock and want to generate additional income from their holdings. Covered calls are considered a low-risk trading strategy compared to the other options strategies, making it one of the best strategies for option trading. Here’s how it works:
1. Understanding Covered Calls
Ownership of the Stock: In a covered call, you must own the underlying stock (typically in lots of 100 shares per option contract).
Selling a Call Option: You then sell a call option on those shares. A call option gives the buyer the right, but not the obligation, to purchase your shares at a specified price (the strike price) within a set time frame.
Income Generation: By selling this call option, you collect a premium (payment) from the buyer. This premium provides extra income, regardless of whether the option is exercised or not.
2. Potential Outcomes of a Covered Call
If the Stock Price Stays Below the Strike Price: The option expires worthless, and you keep the premium as profit. You still retain your shares and can repeat the strategy if desired.
If the Stock Price Exceeds the Strike Price: The buyer may exercise the option, meaning you must sell your shares at the agreed-upon strike price, potentially below the current market value. In this case, you make a profit up to the strike price, plus the premium received, but forfeit any gains above the strike price.
3. Pros and Cons of Covered Calls
Pros:
Generates extra income from shares you already own.
Provides limited downside protection through the premium received.
Cons:
Limits potential upside profit if the stock rises significantly above the strike price.
Doesn’t protect against significant declines in the stock price.
4. When to Use a Covered Call
Covered calls are typically used when you have a neutral to slightly bullish outlook on a stock. It’s ideal if you’re willing to sell the stock at a particular price (the strike price) or want to earn income on the shares you already hold without expecting major price increases.
How to Figure Out which Call Option to Sell?
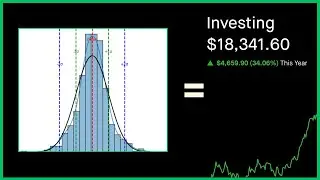
A probability distribution of stock returns is a statistical representation that shows all possible returns of a stock and the likelihood of each return occurring. This distribution can help investors understand the range of potential outcomes (both gains and losses) and make better decisions by considering the probabilities of different return levels.
Key Points about Probability Distributions in Stock Returns
Types of Distributions:
Normal Distribution: Often used to model stock returns, a normal (bell-curve) distribution assumes that most returns are near the average, with fewer returns as you move further from the mean. It’s symmetrical, with equal chances of returns above or below the average.
Log-Normal Distribution: For stock prices (rather than returns), a log-normal distribution is often more realistic since stock prices can’t go below zero and tend to show positive skewness over time.
Other Distributions: Empirical distributions may be better in some cases. For example, stock returns can display fat tails (extreme returns occur more frequently than a normal distribution would predict), so distributions like the Student’s t-distribution or skewed distributions might provide a better fit.
Mean and Variance:
Mean (Expected Return): The average or mean of the distribution represents the expected return of the stock over a period.
Variance and Standard Deviation: Variance measures the spread of returns around the mean, with the standard deviation (square root of variance) often used to quantify risk. A higher standard deviation means returns are more spread out, indicating greater volatility.
Skewness and Kurtosis:
Skewness: Measures asymmetry in the distribution. Positive skewness indicates a distribution with a longer right tail (more potential for extreme positive returns), while negative skewness indicates a longer left tail (more potential for extreme negative returns).
Kurtosis: Measures the “tailedness” of the distribution. Higher kurtosis implies more frequent extreme returns (both positive and negative), commonly referred to as "fat tails."
Uses in Investing:
Risk Assessment: Probability distributions help investors gauge the risk of different return levels, especially the likelihood of extreme losses.
Value-at-Risk (VaR): Investors use distributions to estimate VaR, the maximum potential loss over a period with a certain confidence level.
Options Pricing and Strategy: Probability distributions are crucial for understanding the likelihood of stock prices reaching certain levels, which informs options pricing and strategies (e.g., covered calls, straddles).
*Intrendias is not financial advice.