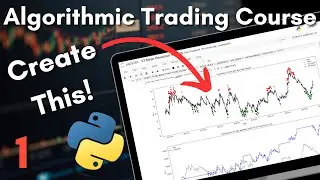
How to Create a Stock Trading Algorithm in Python - Part 1
#python #algorithmictrading #tradingstrategy #technicalanalysis #stockmarket #crypto
Learn how to create a stock trading algorithm with this Python coding video!
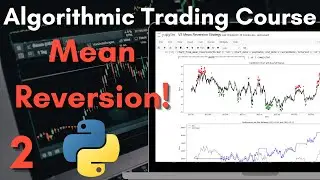
Python Trading Algorithm using Bollinger Bands for Mean Reversion.
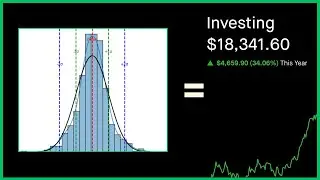
Mean reversion is a financial concept that refers to the tendency of a financial instrument's price, such as a stock, bond, or commodity, to move toward the average or mean over time. In other words, when the price of an asset deviates significantly from its historical average, there is an expectation that it will eventually revert to its average or historical mean.
In our trading algorithm, we will use yahoo finance data to collect open, close, high, low, and volume data to derive Bollinger band values. The algorithm will perform a buy if the close price is below the lower Bollinger band; the trading algorithm will perform a sell if the close price is above the upper Bollinger band.
In Episode 1, we create some custom functions in python that returns the appropriate percent change sign, gathers last price and percent change from yahoo finance using yfinance and yahoo_fin libraries.
Percent Change Symbols: ▲ ▼
Time Stamps
0:00 What and Why Mean Reversion?
2:44 Time to Code!
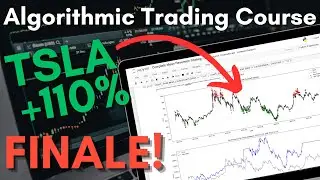
In Episode 2, we will create a stop loss python function using Average True Range to minimize losses if a trade goes south. Plus, we will calculate the Exponential Moving Average (EMA) and Bollinger Bands as technical analysis.
Like and comment down below if you enjoy python, technical analysis, algorithmic trading! Be sure to subscribe to not miss out on the next episode. Thank you for coding and watching with me!
Intrendias Website: https://www.intrendias.com/
Thank you for watching and your support!: / intrendias
Catch me on Instagram: / intrendias
Catch me on Threads: https://www.threads.net/@intrendias
YouTube Channel: / @intrendias
*Intrendias is not financial advice.