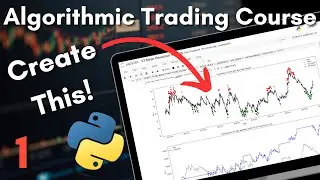
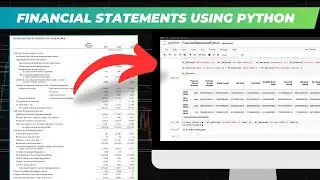
How to Code Fibonacci Retracement in Python
#technicalanalysis #tradingstrategy #stockmarket #fibonacci #python
Learn how to write Fibonacci series in python!
This python course will review how to automatically perform Fibonacci Retracement for your favorite stocks, cryptos, and ETFs using matplotlib, yahoo finance, and custom William Fractals and Fibonacci functions. Instead of trying to find the starting and ending point of the Fibonacci Retracement tool in Trading View, let's automate it in python!
A completed python Jupyter Notebook for the automatic Fibonacci Retracement is available for free in the Blog tab of Intrendias.com!
Timestamps!
0:00 Let's Automate This
0:45 What is Fibonacci Retracement
1:39 Start Coding!
3:05 William Fractals Function
5:14 Visualize the Fractals
7:08 Fibonacci Retracement Function
10:55 Visualize the Fibonacci Automatically!
What is the Fibonacci Retracement?
The Fibonacci retracement tool is a technical analysis tool used in financial markets, particularly in stocks and other securities, to identify potential levels of support and resistance. It is based on the Fibonacci sequence, a mathematical concept where each number is the sum of the two preceding ones.
What are William Fractals?
William Fractals could potentially identify turning points in the price of a stock, crypto, or ETF. A bullish (upward) fractal occurs when the middle bar has the highest high and is flanked by two lower highs on each side. Conversely, a bearish (downward) fractal occurs when the middle bar has the lowest low and is flanked by two higher lows on each side.
Intrendias Website: https://www.intrendias.com/
Thank you for watching and your support!: / intrendias
Catch me on Instagram: / intrendias
Catch me on Threads: https://www.threads.net/@intrendias
YouTube Channel: / @intrendias
Thank you for watching and supporting Intrendias! Happy Coding! Checkout Intrendias.com for simple buy and sell signals based on the Mie Algorithm and the Volume Breakout Algorithm.
The Volume Breakout Algorithm has a 17% edge of the S&P 500 SPY ETF. *
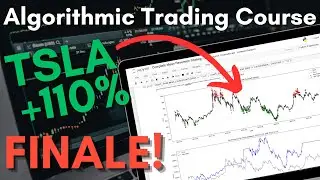
The Mie Algorithm has outperformed on popular stocks like AAPL, SCHW, TSLA, BAC, and more. **
Check out stock and crypto coverage along with more algorithmic trading courses on the Intrendias YouTube channel!
*Back testing results from 1/1/2020 - 12/8/2023.
**Back testing results from 1/1/2021 - 12/8/2023.
***Intrendias is not financial advice.