Automated terminal plotting with entr
There are two ways to plot in the terminal.
1. terminal graphics like Unicode.jl
2. Pushing images to cloud storage and viewing in the browser
This video covers #2.
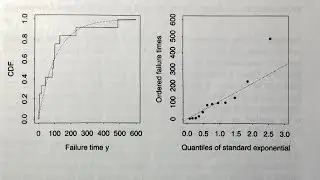
I work primarily in the terminal. When I am trying to communicate results I create high quaility visuals. This video shows how I push images that I create in the terminal to cloud storage. Though I show google cloud storage in this video I have also used these same ideas with S3 buckets.
This is the link to the google sdk:
https://cloud.google.com/sdk/docs/qui...
0:00 Start
0:18 Outline
2:30 Get Google cloud utilities
4:47 Automation with entr


![Lightning-Fast Setup: Get VS Code & Python Up and Running in No Time [Windows | 2023]!](https://images.mixrolikus.cc/video/EdxAUXXGB_M)