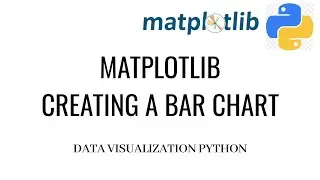
Matplotlib Barplot | Creating bar chart | Barplot in python
Barplots are often used in Finance and Marketing sectors for visualizing revenues and profits of organization.
Barplots shows relationship between numerical and categorical variables
Matplotlib basic tutorial | Creating bar graphs | Matplotlib horizontal bar chart | Python bar graphs with labels