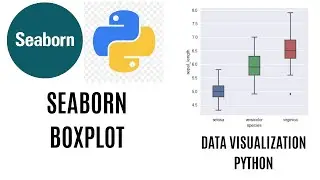
Boxplot in Seaborn | Seaborn Boxplot Python
A boxplot is a standardized way of displaying the distribution of data based on a five number summary (“minimum”, first quartile (Q1), median, third quartile (Q3), and “maximum”). Boxplot can tell you about your outliers and what their values are.
Boxplot Python tutorial | Seaborn Boxplot | Boxplot Python Seaborn |
Boxplot Seaborn Documentation:
https://seaborn.pydata.org/generated/...