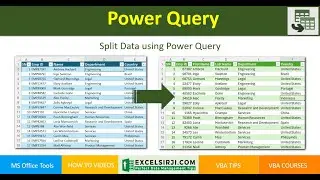
Grouping and Ungrouping Rows and Columns in Excel :Quick Guide
Grouping and ungrouping columns and rows in Excel is a simple yet powerful feature that can add value to your big data analysis. It enables plus (+) and minus (-) buttons to quickly hide and unhide data, making it easier to navigate large datasets.
📌 Chapters
⏳ 0:00 - Introduction
A quick overview of how grouping and ungrouping work in Excel.
⏳ 0:19 - Why Use Grouping in Excel?
Grouping helps in organizing data efficiently, making it easier to read and analyze.
⏳ 0:42 - How to Group Rows & Columns
1️⃣ Select your data in Excel.
2️⃣ Go to the Data tab.
3️⃣ Click on the Outline section.
4️⃣ Select the columns or rows to group.
5️⃣ Click on Group, and Excel will add a + (plus) button to expand and - (minus) button to collapse data.
⏳ 1:11 - How to Ungroup Rows & Columns
Click on Ungroup in the Outline section.
If you want to remove all grouping at once, click Clear Outline.
⏳ 2:11 - Shortcut Keys for Faster Grouping
Alt + Shift + → (Right Arrow) → Group selected data.
Alt + Shift + ← (Left Arrow) → Ungroup selected data.
⏳ 3:00 - Conclusion & Next Steps
Grouping and ungrouping are essential tools for organizing and simplifying large datasets. Try it out, and make your Excel workflow smoother!
Hope you like this video, please do subscribe our channel
Links of our different playlists to Excel Basics
You can also get this training and more resources here https://www.excelsirji.com
If you wanna support us and want us to write more. You can buy us a coffee from here:
https://www.buymeacoffee.com/excelsirji