28 тысяч подписчиков
139 видео
Introduction to Queries with MySQL Workbench & Sakila Sample Database
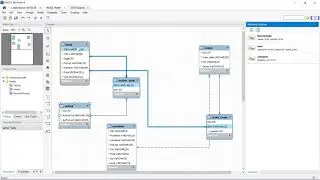
How to Make and Use an ERD/EER Diagram in MYSQL Workbench
Python for Stock Analysis: Plotting Performance Grid of Multiple Securities w\matplotlib || Part 7
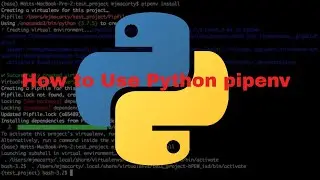
How to Use pipenv for Python Virtual Environments
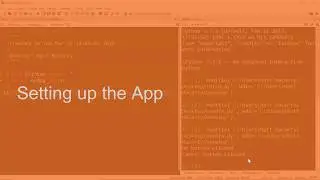
Setting up a Tkinter Application Class in Python GUI Application
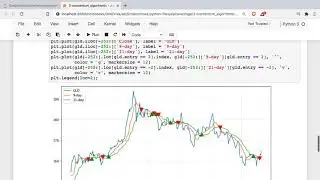
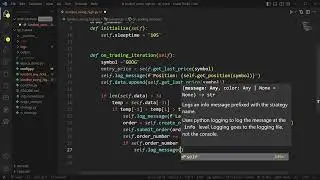
Introduction to Algorithmic Trading Using Python - How to Create & Test Trading Algorithm
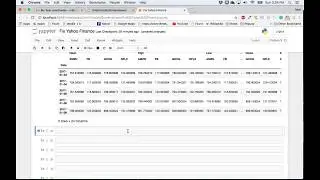
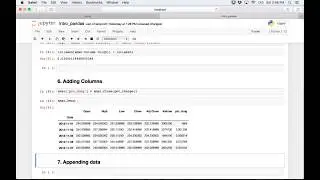
Stock Analysis with Python: How to Extract Price Data from Files || Part 4
Get Started with Tkinter and GUI Applications in Python
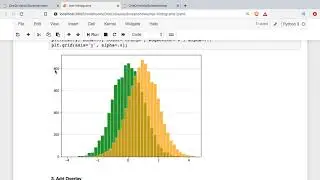
Introduction to matplotlib Python Bar Charts, Annotation & Histograms with Python
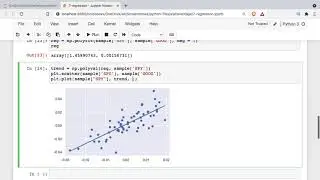
Linear Regression Model Techniques with Python, NumPy, pandas and Seaborn
Pandas Datareader Yahoo Finance Workaround: fix-yahoo-finance
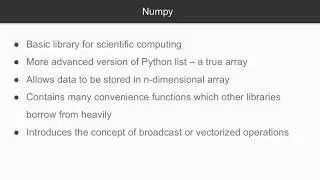
Introduction to NumPy and NumPy Arrays for Beginners, Part I Python Tutorial
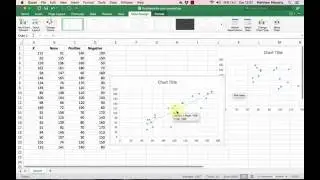
How to Make and Interpret a Scatter Plot in Excel
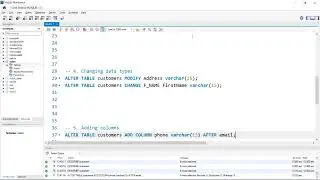
How to RENAME, COPY, EDIT & MODIFY DATABASES, ADD & DROP FOREIGN KEY, CONSTRAINTS in MySQL Workbench
How to Build a Python Momentum Algorithm Trading Bot w/ Lumibot & Alpaca
Python (OOP) Intro to Inheritance & Documentation || Object Oriented Programming in Python Part 5
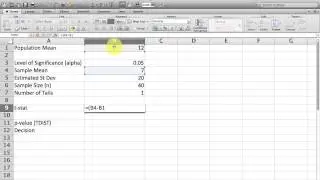
How to Use the TDIST Function in Excel || TDIST Formula
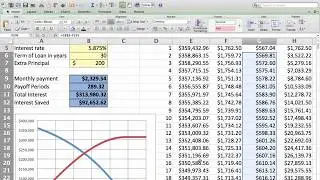
How to Make Loan Amortization Tables in Excel || Download Demo File
Stocks About to Announce Earnings or Dividends! (Download Now!)
Intro to Object Oriented Programming, Creating Classes in Python for Beginners || Part 1
How to Run Paired Samples t-Test in SPSS Tutorial || Paired t-test SPSS
Using Free Real Time Alpha Vantage Stock Price API & Python to Download and Analyze Stock Data
How to Automatically Integrate Financial Data with Google Sheets
Quantitative Stock Price Analysis with Python, pandas, NumPy matplotlib & SciPy
Setting up a Python Environment and Getting Started with PyCharm for Python Anaconda Plugin
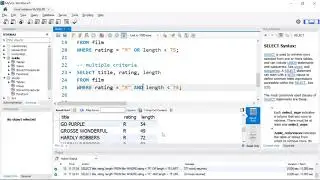
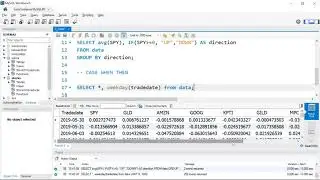
How to Use IF and CASE WHEN in MySQL Workbench SQL Tutorial
How to Calculate Stock Investment Portfolio Volatility with Python, NumPy & Pandas
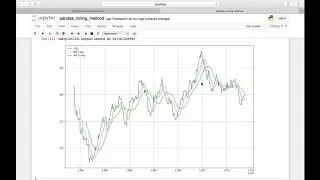
Python Pandas || Moving Averages and Rolling Window Statistics for Stock Prices
How to Resize Images for Use on Webpages and Websites
Essential Introduction to Pandas DataFrame || Learn Python Pandas
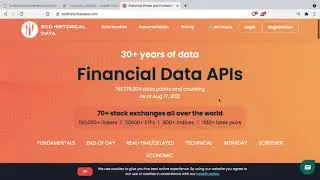
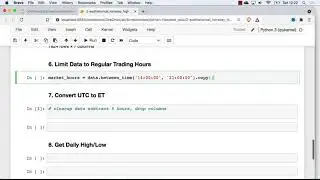
Use End of Day (EOD) Historical Data API to Find Time of Daily High/Low
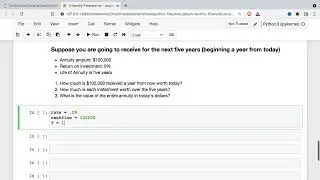
How to Use NumPy Finance for Python Present Value (pv) Function
Data Analysis of Stock Price Changes for Algorithmic Trading with Python & pandas
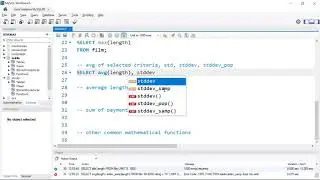
MySQL Statistics and Mathematical Functions
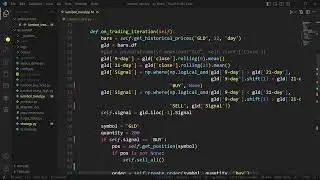
Create a Live Trend Following Algorithmic Trading Bot for Gold
Download, Transform and Write Data to Excel with Python || Stock Analysis with Python Part 6
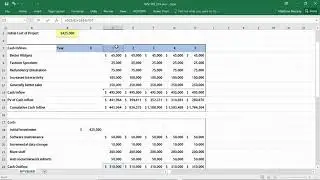
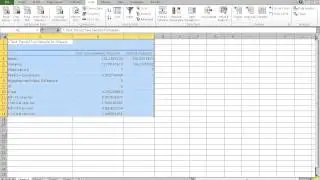
How to Calculate NPV, IRR & ROI in Excel || Net Present Value || Internal Rate of Return
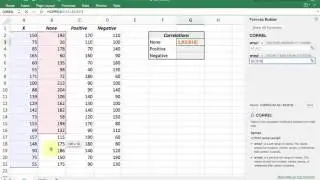
Using Excel to calculate a correlation coefficient || interpret relationship between variables
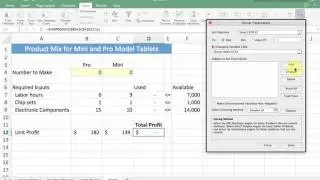
Linear Programming (LP) Optimization with Excel Solver
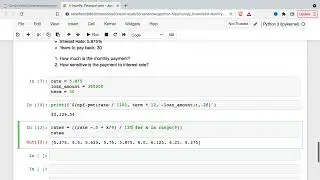
Calculate & Analyze Loan Payments with Python NumPy Financial pmt Function
Pay Off Your Mortgage Loan Faster with Excel NPER Function
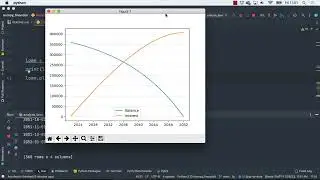
Python for Finance Automation Project: Make a Mortgage Loan Analysis Class
How to Run a Paired Samples t-test in Excel
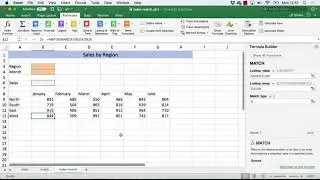
How to Use Excel's Index and Match Functions
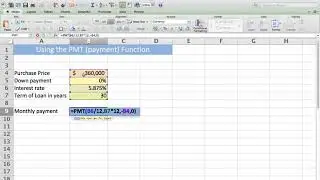
How to Use Excel PMT Function to Calculate Loan Payments
How to Get a List of Stocks on an Exchange || Stock Analysis with Python Part 1
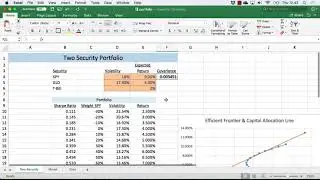
Portfolio Optimization Seven Security Example with Excel Solver
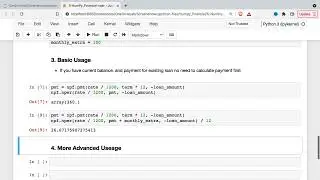
Find Number of Payments in a Loan with Python & NumPy Financial nper Function
How to Backtest Trading Algorithms and Portfolio Metrics with Python and QuantStats
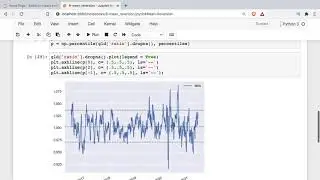
Python for Stock Analysis: Automatically Calculate & Graph Stock Returns & Volatility || Part 11
Introduction to Algorithmic Trading with Python: Create a Mean Reverting Trading Algorithm