Quantitative Stock Price Analysis with Python, pandas, NumPy matplotlib & SciPy
#pythonprogramming #Stock #DataAnalysis
https://alphabench.com/data/pandas-qu...
✅ Please SUBSCRIBE:
https://www.youtube.com/subscription_...
Try my Hands-on Python for Finance course on Udemy: https://www.udemy.com/hands-on-python...
*For Educational purposes only. Should not be construed as investment advice.
✅ Watch my other Stock Analsis videos:
https://alphabench.com/data/pandas-ro...
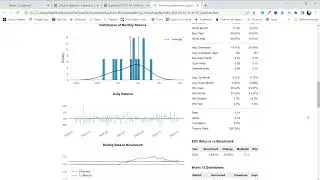
In this video, we look at some quantitative analytical methods of stock price changes using Python and pandas. We also see some NumPy and SciPy functionality. This video is meant to be a primer for using pandas for quantitative stock analysis. In particular we're going to be trying to decide whether or not the stock price change can be described as a normally distributed phenomenon; next we're going to be trying to decide if there's a directional bias in this daily change, that is is it biased to be positive or negative and then finally we're going to be trying to see if the price movement can be described as a random walk. While these are concepts you might cover in a college-level investment analysis course, the goal is really just to get you comfortable using Python and pandas to analyze stocks. I'm going to be using a Jupyter notebook here and I'm going to make the notebook available from a link in the video description so you can download it.
**This video is for educational purposes only. The information provided should not be construed as investment advice. **
✅ Download a working copy of the Jupyter notebook here:
https://github.com/mjmacarty/alphavan...
Covers some basic stock price movement analysis, in the form of data transformation, adding columns to DataFrame and data visualization with histogram and an interesting take on scatter plots. python pandas tutorial.
data science
data analytics