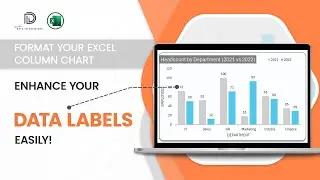
Creating Tornado Charts for Sensitivity Analysis in Excel
Welcome to yet another video from #datatodecisions.
Our in-depth tutorial on creating Tornado Charts for Sensitivity Analysis in Excel enhances your data analysis skills.
In this video, we demonstrate how to create a Tornado chart, specifically for performing sensitivity analysis.
This tutorial is perfect for project managers, financial analysts, and anyone looking to make data-driven decisions.
Enhance your data visualization skills with this practical guide. Don’t forget to like, subscribe, and hit the notification bell for more Excel tutorials. Share your questions and feedback in the comments below!
******************************************************************************
Are you looking for a quick, instant chart-maker template where you can enter just data and have charts readily created for you?
Check our latest product, the Instant Chart Maker from our Data Visualization Toolkit in Excel: https://indzara.com/product/data-visu...
******************************************************************************
The detailed blog post for this chart creation is here: https://indzara.com/create-tornado-ch...
Check our Premium Bar Chart Excel Template here:
https://indzara.com/product/data-visu...
Here’s our collection of Visualization templates from Indzara:
https://indzara.com/data-visualizatio...
For more such tutorials, visit https://indzara.com/datatodecisions/
#excelmadeeasy #exceltips #excelchartstutorial #exceltricks #datavisualization #barchart


