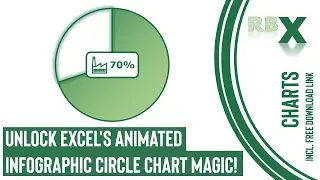
Unlock Excel's Animated Infographic Circle Chart Magic!
Delve into the World of Excel's Animated Infographic Circle Charts!
Join me in exploring the captivating realm of animated infographic circle charts within Excel. Uncover the art of crafting visually compelling data representations. From percentage inputs to precise placement of data labels and icons, this tutorial unravels the secrets behind creating dynamic and engaging circle charts. Elevate your data visualization skills and craft stunning charts that captivate your audience!
Download link to the Excel file used in the video: https://drive.google.com/uc?export=do...
0:00 - Intro
0:52 - Create the data
1:14 - Inserting and formatting the circle chart
3:21 - Creating the data label with icon
6:22 - Change setting and hide helper column