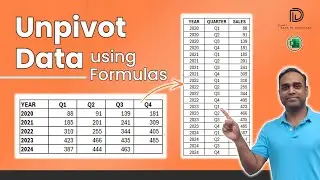
Create Motion Bubble Charts & Scatter Plots in Excel
Free Excel template to create motion bubble charts and scatter plots. Animated Single series and multi-series bubble charts and scatter plots.
Free template: https://indzara.com/2021/09/motion-bu...
More data visualization templates: https://indzara.com/excel-templates-d...
Download template and create animated or motion bubble charts and scatter plots with your own data. In this video, I demo the template and walk through how to enter data to do 4 types of analysis. I also share how to customize the formatting to your needs.
Reporting and Analysis - Data Visualization - Business Intelligence simplified
Chapters
00:21 Entering raw data for 3 quantitative variables
02:26 Choosing series data for chart
04:20 Chart features and functionality -Animate/Play, Pause and Reset motion Chart
05:30 Control Animation speed
06:07 Manual slider to change year and update chart
06:30 Change step of the chart animation
07:30 switch between scatter plot and bubble chart
08:08 Max number of years
08:18 Legend of Bubble chart
08:45 Formatting – Change bubble colors
09:30 control bubble scale
10:15 Analysis by cohorts (continents) – multi-series
10:30 Analysis of entire population – Single-series
11:20 Highlight one bubble versus the cohort
12:08 Compare two bubble (two countries)
12:40 Formatting Data labels
14:25 controlling the Axis bounds (minimum and maximum)