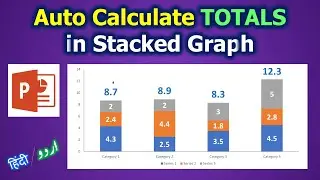
How to Calculate Total Values for Stacked Charts in PowerPoint | Stacked Graph Totals | ICT Nuggets
In this video, we will show you How to Calculate Total Values for Stacked Charts in PowerPoint - The Stacked Graph Totals can be calculated in PowerPoint easily. In the first step, you create a stacked graph in PowerPoint and then you edit the back-end data to add totals for each value of the graph. After that, you change the type of the graph for total value to line graph. After that, we can easily modify the line graph to turn off colors, and then we can enable data labels of the total. In the end, we can format the data label by changing font size, color, and position. I hope this video will help you achieve your work. Please like the video and subscribe to our channel ICT Nuggets.
Subscribe to our channel: https://bit.ly/3eSNKwL
How to use google forms - • How to use google forms | Google forms for...
================================================
YouTube: / ictnuggets
Facebook: / ictnuggets
Website: http://www.ictnuggets.com
================================================
#ICTNuggets #StackedGraph #PowerPointTutorials