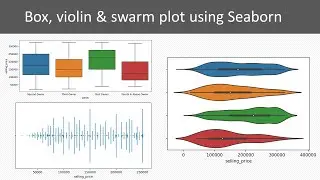
box, violin & swarm plot using seaborn, matplotlib and pandas | python
In this video I will show you boxlot, violinplot and swarmplot using seaborn , matplotlib and pandas. I will read a csv file for carsdata and then plot variations of boxlot, violinplot and swarmplot.
dataset: https://drive.google.com/file/d/1wL9E...
Follow me on:
Twitter: / ishaans54694584
LinkedIn: / ishaan-sharma-245b051a1
#python
#beginner