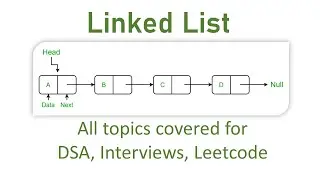
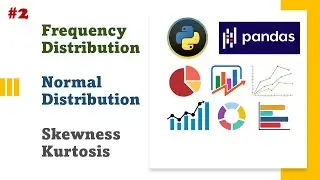
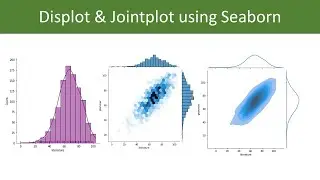
displot and jointplot using seaborn, matplotlib and pandas | python
In this video I will show you displot and jointplot using seaborn , matplotlib and pandas. I will read a csv file for marks data and then plot variations of distribution plot and jointplot.
dataset: https://drive.google.com/file/d/1V6E5...
Follow me on Instagram: / ishaansharma711
#python
#beginner