A better automated Gantt Chart in Excel
Welcome to this video that shows you to make a better Gantt chart in Excel that is both automated and doesn't require you to invert charts but just enter in a view simple formulas.
Still some audio issues, sorry about this, am working on it!
Please remember that with these formulas they work based on the cells, so if you are not using the same cells for the data as me, make sure you adjust the values accordingly!
Chapters:
0:00 Video Intro
0:30 The specs that this chart is based on
1:18 Setting up the calculation table for the values
3:08 Simple column calculations
4:57 Using the ROUNDUP function
6:06 Basic date formatting
7:26 Using WORKDAY function to calculate date
10:22 Working out the start day and date for job 2
12:00 Adding the column dates for the Gantt chart
13:50 2nd example of using WORKDAY
14:22 Conditional formatting - create anew rule
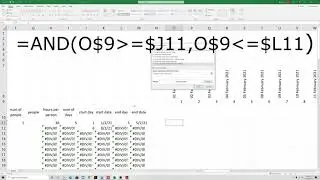
15:12 Using the AND keywork for multiple criteria
15:30 The meaning of the $ sign in Excel
17:07 The first criteria
18:07 The second criteria
19:03 Selecting the fill colour
19:18 Applying the rule across the chart grid
20:28 Checking it works
21:00 Dealing with simultaneous jobs (reseeding the row)
23:28 Want multiple colours
25:44 Video wrap up


![How to Fix the cannot [x] of null JavaScript Error JS1](https://images.mixrolikus.cc/video/kMwyeo7mEhY)