Map My School for Kids with Google Earth Engine
Learn how to use Google Earth Engine and Javascript to make a map of your school and determine how much shade you have on your campus. Here's the code I've used
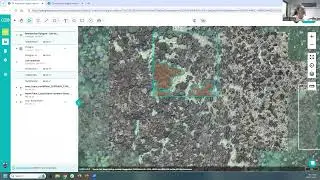
//Navigate to AOI (long, Lat, zoom)
Map.setCenter(145.6908, -16.8158, 16);
//Find out area of boundary in m^2
var boundarea = boundary.area();
print('Boundary area in m^2: ', boundarea);
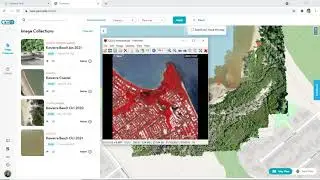
//calculate the area of the 'trees' polygon in square meters
var tarea = trees.area();
print('Tree area in m^2: ', tarea);
//calculate the area of the 'buildings' polygon in square meters
var buildarea = buildings.area();
print('Building area in m^2: ', buildarea);
//calculate the percentage of trees compared to the whole area
var tpct = tarea.divide(boundarea).multiply(100);
print('Tree Percent: ', tpct);
//calculate the area of the 'ground' remaining in square meters
var groundarea = boundarea.subtract(tarea).subtract(buildarea);
print('Ground area in m^2: ', groundarea);
///////////Graph the results////////////////////
// Define a DataTable using a JavaScript literal
var dataTable = {
cols: [{id: 'type', label: 'Type', type: 'string'},
{id: 'area', label: 'Area (m^2)', type: 'number'}],
rows: [{c: [{v: 'Trees'}, {v: 640403}]},
{c: [{v: 'Ground'}, {v: 475938}]},
{c: [{v: 'Buildings'}, {v: 32929}]}]
};
// Define customization options.
var options = {
title: 'Amount of Ground Cover at James Cook University',
hAxis: {title: 'Categories'},
vAxis: {title: 'Area Covered (m^2)'},
};
print ('data table', dataTable);
// Make a Column Chart from the table and the options.
var chart = new ui.Chart(dataTable, 'ColumnChart', options);
// Print the chart to display it in the console.
print(chart);