Dynamic Measures & KPIs in Excel Charts using Slicer
Step by Step tutorial - How to create charts with dynamic measures or KPIs using a slicer control.
Build interactive reports and dashboards in excel using this simple and effective technique.
More at https://indzara.com/dataviz
Chapters
00:00 Introduction
00:34 Set up input data in a table
01:22 Set up table of measures
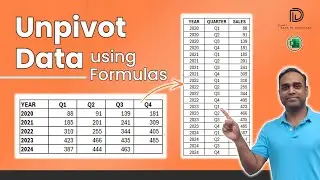
01:52 Helper table - X Axis values calculations using UNIQUE function
02:30 Y Axis calculation - dynamic calculation of measure - Nested IF functions
05:50 Create a column chart
06:51 One problem with the chart - What if new data is added to input table?
07:28 Solution: Create Named ranges to be used in Chart
10:09 Creating a Slicer control for dynamic KPI / Measure chart (using pivot table)