17 тысяч подписчиков
241 видео
Visualize Correlation Matrix Using Correlogram||#rstudio ||#visualization ||#rprogramming
How to make a heatmap in R Studio? ||
Download History Climate Data and Calculate Drought Index (SPI) in R Studio:|
How to Add Multiple Line to One Graph with Legend Customization||#ggplot2||#rstudio |#visualization
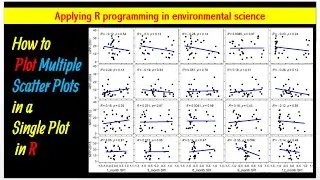
Multiple Scatter Plots in a Single Plot With R-Square and P-Value||
How To Plot Simple Linear Regression With Adding Liner Regression In R Studio||#regression
Compute and Visualize Correlation Matrix in R||
Mix Multiple Graphs in The Same Plot||
Plot Two Graphs With The Same X Axis and Different Y Axis|| Plot two graphs in same plot in R
Multiple Line Graphs in The Same Plot in R💯☑️ ||
How to Make Time Series Climate Data in R |
How to Plot
Amazon River Formation During Years||
How to Calculated SPEI Drought Index || Drought Severity|| Food security
Plot Pearson Correlation Coefficient of Multiple Variables|| R Studio
Water Level at Bartlett Reservoir in Arizona ||
Mountaintop Removal at West Virginia, United States||
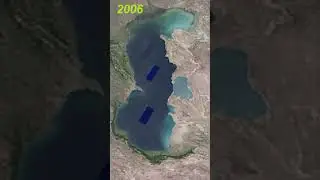
The Caspian Sea is Never Been Sea, But is Shrinking ||