Multiple Scatter Plots in a Single Plot With R-Square and P-Value||
Multi-variable Scatter Plots and Line Charts
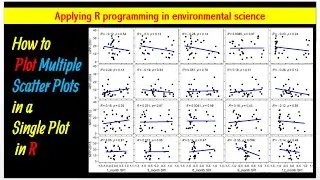
Here you will learn how to generate a figure that displays some scatter plots on this single figure and each plot in the figure shows an R-square and p-value.
here you can find the code:
https://github.com/ResNeed/Multiple-S...
The Effect of drought on NPP( vegetation)
R-Studio Tutorial: Multiple Lines in One Plot With ggplot
ggplot - How to Plot 2 Graphs in Same Plot in R
How to plot multiple lines on the same graph using R
How To... Plot Multiple Datasets on the Same Chart in
How to Plot multiple lines on Same Graph from Same Dataset
Draw 2 Graphs in Same Plot in R (Example) | Multiple Plots & Lines
☑️How to Make Time Series Climate Data in R | #Trend Data in R | Plot Time Series ☑️
• How to Make Time Series Climate Data ...
☑️How to Plot #ndvi time series in R Studio|| Normalized Difference Vegetation Index☑️
• How to Plot #ndvi time series in R...
☑️Plot Pearson Correlation Coefficient of Multiple Variables|| R Studio☑️
• Plot Pearson Correlation Coefficient ...
If you like my video don't forget to like, share and subscribe to my channel.
/ @resneed1
🙏Thank you so much for watching.🙏
#rprogramming
#scaterplot
#ggplot2