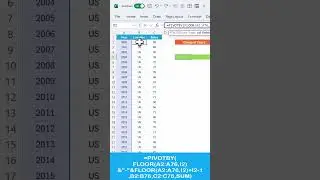
Vertical Timeline Chart using Scatter chart in Excel
#TimelineChart #ExcelInfographics
Hello Friends,
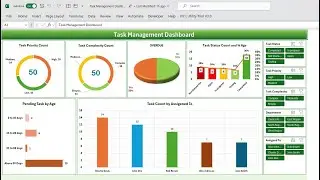
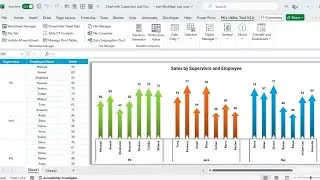
In this video, you will learn how to create a vertical timeline chart using Scatter Chart in Excel. A timeline chart is an effective way to visualize the different Milestones of a project. This is a dynamic Chart if you will add a new milestone in table, it will be reflected on the chart automatically. This can be useful for your Project Management Dashboard.
Click here to download the practice file:
https://www.pk-anexcelexpert.com/vert...
Download our free Excel utility Tool and improve your productivity:
https://www.pk-anexcelexpert.com/prod...
See our Excel Products:
https://www.pk-anexcelexpert.com/prod...
Visit to learn more:
Chart and Visualizations: https://www.pk-anexcelexpert.com/cate...
VBA Course: https://www.pk-anexcelexpert.com/vba/
Download useful Templates: https://www.pk-anexcelexpert.com/cate...
Dashboards: https://www.pk-anexcelexpert.com/exce...
Watch the best info-graphics and dynamic charts from below link:
• Dynamic Graphs
Learn and free download best excel Dashboard template:
• Excel Dashboards
Learn Step by Step VBA:
• VBA Tutorial
Website:
https://www.PK-AnExcelExpert.com
Facebook:
/ pkanexcelexpert
Telegram:
https://t.me/joinchat/AAAAAE2OnviiEk5...
Pinterest:
/ pkanexcelexpert
************ Suggested Books ********
VBA: https://amzn.to/2TMMikX
Excel Dashboard: https://amzn.to/2WZi2Fj
Power Query: https://amzn.to/2Ibd7xR
Power Pivot and Power BI: https://amzn.to/2DCg8BB
Exam Ref 70-778 (Power BI): https://amzn.to/2GnWYTN
************ My Stuff ***************
Mic : https://amzn.to/2TLnF88
Video Editor: https://screencast-o-matic.com/refer/...
https://amzn.to/2PlFFFz