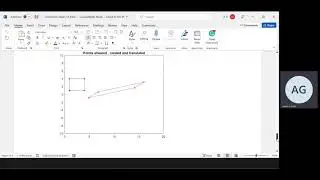
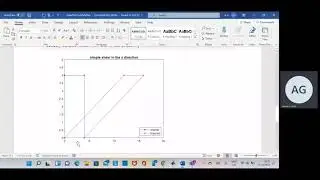
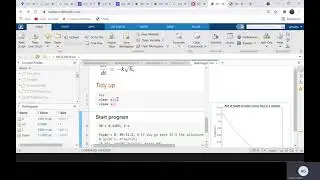
How to shear points point in Matlab not using the inbuilt functions. Code in description
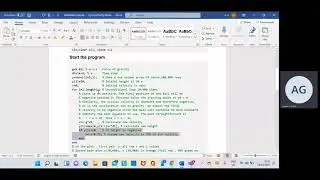
%Simple demo of 2D Shear in X in MATLAB
k = 3; % shear factor
% create a simple box to draw and manipulate
% row 1 is x coords row 2 is y coords
pts = [0 0 4 4 0;0 4 4 0 0];
% Plot box
figure(1)
plot(pts(1,1:end),pts(2,1:end),'b*-');
axis([0 5 0 5])
shg % Show current figure
% create a 2D Shear in X matrix
shear = [1 k;0 1]; % k is the shear for x direction
shear = 2×2
1 3
0 1
% Do Shear
shear_pts = shear*pts;
% Plot Sheared box
hold on % Keep the same figure as above
% plot the shear points in red
plot(shear_pts(1,1:end),shear_pts(2,1:end),'r*-');
legend('original','sheared','Location','southeast')
axis([0 20 0 5]); % x axis 0 to 20, y axis 0 to 5
title('simple shear in the x direction')