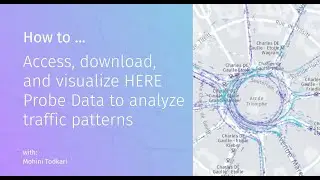
How to use the HERE Traffic Probe Data
HERE Probe Data is a location enrichment service that identifies how people and vehicles travel. It supports several use cases across multiple industries, including, but not limited to, the following examples:
Enable businesses and national, regional, and city authorities to analyze and optimize traffic signal timing.
Accurately map and analyze congestion, while modeling seasonal and historical traffic speeds and volumes to help traffic flow optimization and city planning.
Enable the study of route patterns and point traffic analysis.
Support drive time area calculations that can enhance IVI and ADAS systems for greater in-car comfort, awareness, and safety.
Gain a clearer picture of potential public safety improvements through enhanced road risk modeling, air quality measurement, and smart street lighting.
Provide up to two years of historical location data.
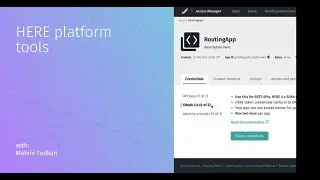
In this video, we talk about how to access the probe data from your HERE platform account, converting the protobuf files to csv, and finally visualizing it in ArcGIS Pro using time-enabled layers for heatmap.
Resources:
Better understand the movement of people and vehicles with HERE Probe Data: https://www.here.com/learn/blog/bette...
How to Access and Download HERE Probe Data to Analyze Traffic Patterns:
https://www.here.com/learn/blog/how-t...
HERE Probe Data: Geospatial Analysis and Visualization: https://www.here.com/learn/blog/here-...
HERE Probe Data Visualization with Python: https://www.here.com/learn/blog/here-...
HERE Probe Data Visualization with QGIS: https://www.here.com/learn/blog/here-...
{chapters}
00:00 – Introduction
00:20 – Getting started with probe data on the HERE platform
02:40 – Download HERE Probe Data layers with the command-line interface
03:45 – Convert the protobuf file to CSV
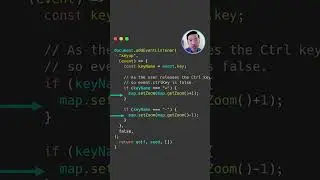
04:05 – Visualize the probe data in ArcGIS Pro
------------------------------------------
HERE Website: https://here.com
HERE 360 Blog: https://360.here.com
HERE Facebook: / here
HERE Twitter: / here
HERE Instagram: / here
HERE LinkedIn: / here


![[FREE / フリートラック] JAKEN × 18stop Type Beat](https://images.mixrolikus.cc/video/L-7azJE_fz8)