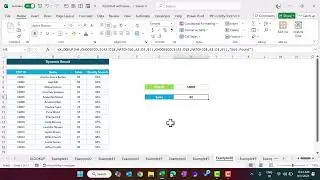
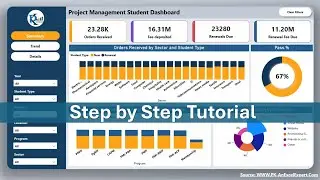
Infographics: Progress Circle Chart in Excel
Hello Friends
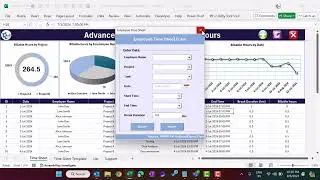
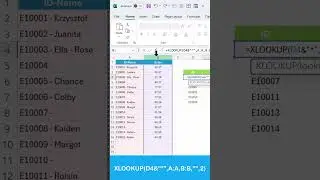
In this video you will learn how to create Progress Circle Chart in Microsoft Excel. You can use this in your dashboards or in reports.
Subscribe our new YouTube Channel:
/ @neotechnavigators
Our Course of Excel Pivot Tables for Data Analysis: Basic to Advanced:
https://www.udemy.com/course/excel-pi...
Please download this excel file from below given article:
https://www.pk-anexcelexpert.com/adva...
Learn how to create Progress Circle chart in Excel 2010:
• Progress Circle chart in Excel 2010
Watch the best info-graphics and dynamic charts from below link:
• Dynamic Graphs
Follow me on Facebook:
/ pkan-excel-expert-974812222655234
Website:
https://www.PK-AnExcelExpert.com
Pinterest:
/ pkanexcelexpert
Telegram: https://t.me/joinchat/AAAAAE2OnviiEk5...
blogger: http://pk-anexcelexpert.blogspot.in/
Twitter:
/ priyendra_kumar
************ Suggested Books ********
VBA: https://amzn.to/2TMMikX
Excel Dashboard: https://amzn.to/2WZi2Fj
Power Query: https://amzn.to/2Ibd7xR
Power Pivot and Power BI: https://amzn.to/2DCg8BB
Exam Ref 70-778 (Power BI): https://amzn.to/2GnWYTN
************ My Stuff ***************
Mic : https://amzn.to/2TLnF88
Video Editor: https://screencast-o-matic.com/refer/...