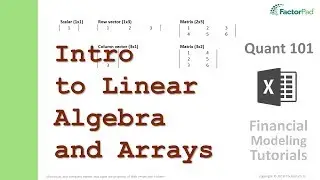
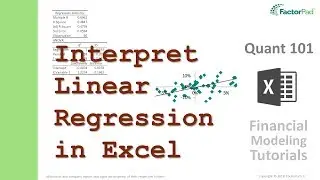
Generate and interpret a linear regression in Excel | Financial Modeling Tutorials
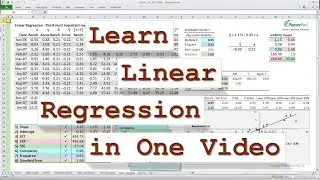
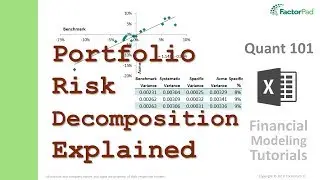
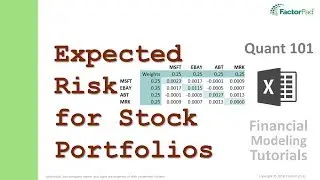
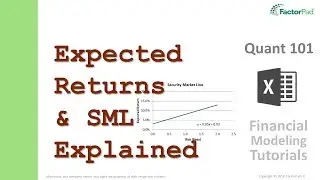
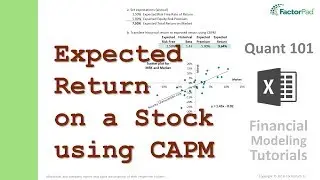
A financial modeling tutorial using linear regression analysis with Excel's Data Analysis and using Excel regression functions and interpret regression output to set expected returns on stocks in a data analytics course Quant 101.
For the video transcript including all formulas see:
https://factorpad.com/fin/quant-101/i...
Zoom straight to the section you are interested in:
01:02 - Video Outline
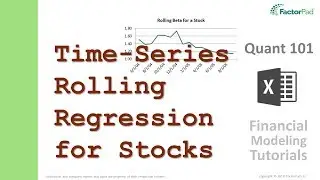
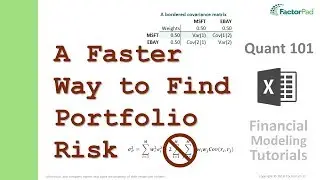
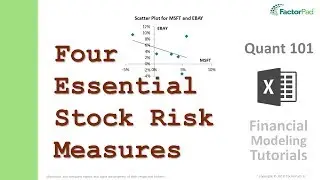
01:40 - Step 1 - Create a Scatter Plot in Excel
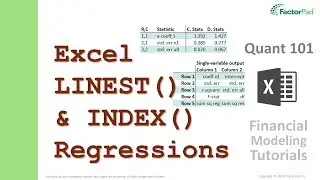
06:07 - Step 2 - Excel Data Analysis of Regressions
08:46 - Step 3 - Excel Regression Functions
11:07 - Step 4 - Interpret Financial Time-Series
17:38 - Summary
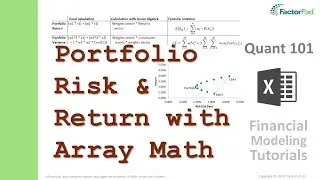
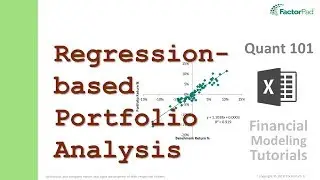
18:32 - Step 5 - Next: Portfolio Performance
For the outline to the Playlist see:
https://factorpad.com/fin/quant-101/q...
See what else there is to learn at:
https://factorpad.com
Happy Learning!


![Baaje Khatiya Char Char [Bhojpuri Video]Feat.Ravi Kishan & Pakhi](https://images.mixrolikus.cc/video/We4oVHR1Yxw)