Mel Spectrograms with Python and Librosa | Audio Feature Extraction
Audio feature extraction is essential in machine learning, and Mel spectrograms are a powerful tool for understanding the frequency content of audio signals. Let's dive into a quick guide on using Mel spectrograms with Python's Librosa library.
Key Concepts:
Audio Feature Extraction: Simplifies complex audio data for tasks like speech recognition and music analysis.
Mel Spectrograms: These visuals highlight important audio frequencies, aligning with how our ears perceive sounds. Think of it as a way to "see" the unique fingerprint of an audio signal.
Quick Python Code:
import librosa
import librosa.display
import matplotlib.pyplot as plt
import numpy as np
Load Audio File
y, sr = librosa.load('path/to/audio/file.mp3')
Extract Mel Spectrogram
mel_spectrogram = librosa.feature.melspectrogram(y=y, sr=sr)
Convert to Decibels (Log Scale)
mel_spectrogram_db = librosa.power_to_db(mel_spectrogram, ref=np.max)
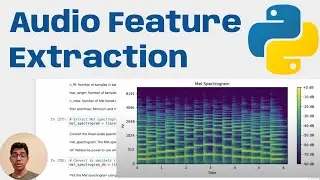
Plot Mel spectrogram
plt.figure(figsize=(10, 4))
librosa.display.specshow(mel_spectrogram_db, x_axis='time', y_axis='mel', sr=sr, cmap='viridis')
plt.colorbar(format='%+2.0f dB')
plt.title('Mel Spectrogram')
plt.show()
Subscribe, Like, and Share for more videos: https://www.youtube.com/c/CloudDataSc...