Matplotlib tutorial for line plot and bar chart | Matplotlib plot CSV
Matplotlib plot by using CSV file. In this tutorial I'll show how to plot simple line chart and in every next plotting I'll complicate the chart. This video is without my vocal explanation but I added comments for easy understanding.
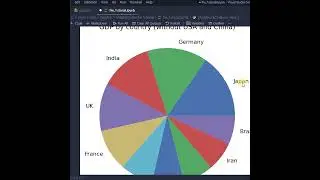
In the second part of the video I'll show how to plot bar chart by using data from CSV file.
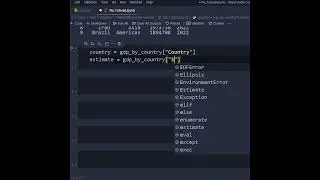
If you prefer to use array instead of the CSV file, than copy Country and Estimate columns and create x and y with data.
GitHub for CSV data and completed ipynb file here: https://github.com/NadiiaCode/Matplot...
Download the CSV file and store in the same folder that Jupyter Notebook file.